You need practical ways to keep goods moving and customers happy when disruptions hit. This introduction explains what supply chain resilience means for your operations and why it matters now. It highlights core pillars and the tech that turns plans into action.
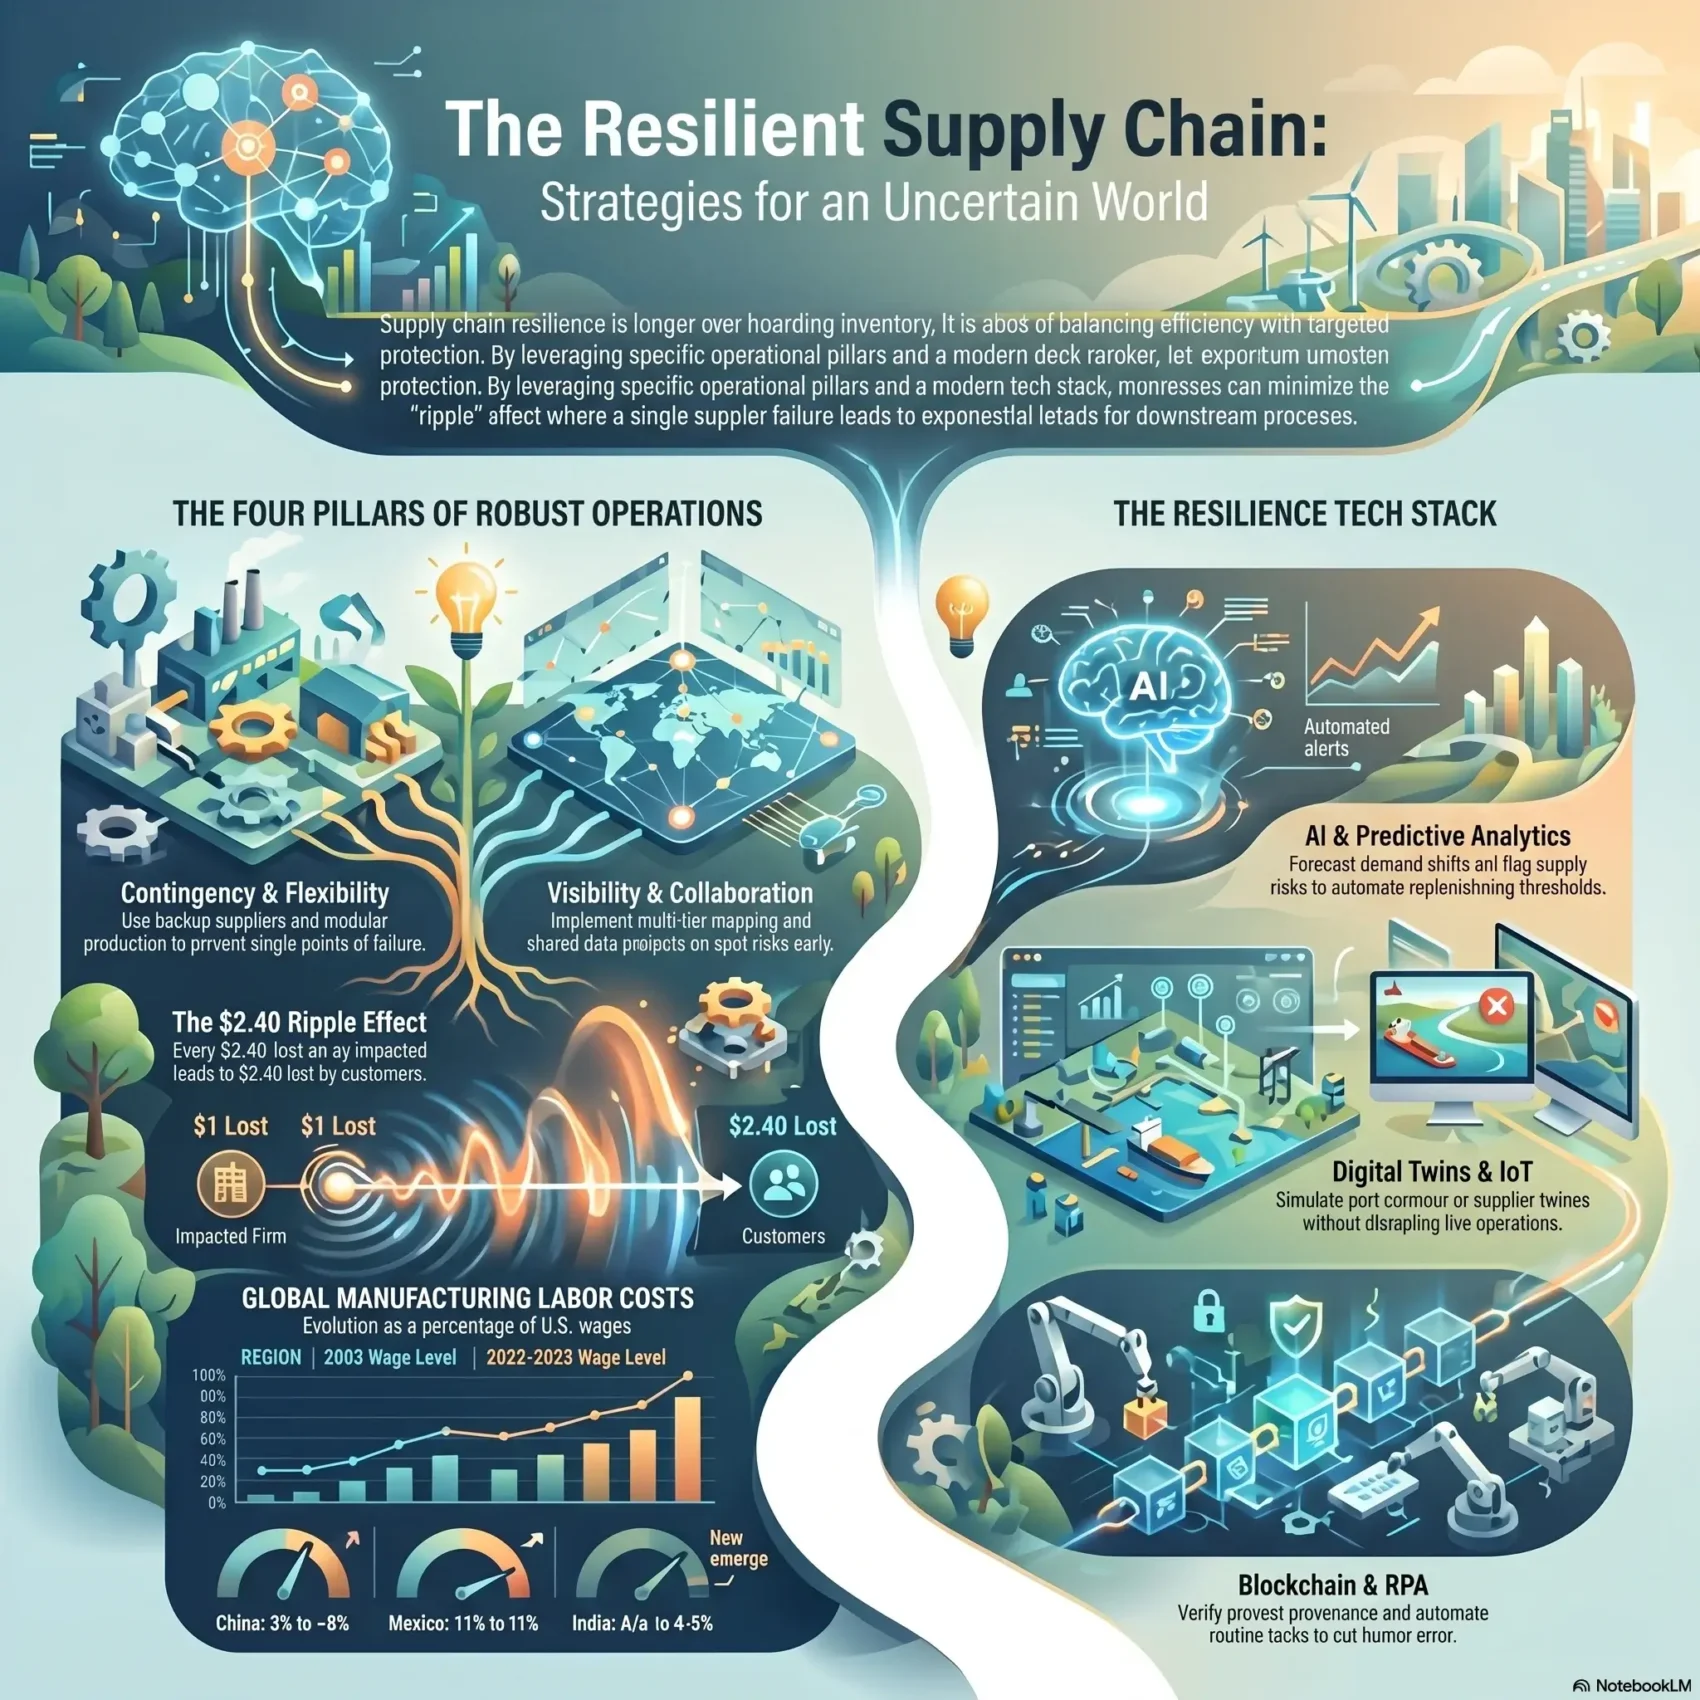
The four pillars—contingency, flexibility, visibility, and collaboration—drive continuity without excess cost. Modern tools like AI/ML, blockchain, digital twins, IoT, cloud, and RPA give you faster insights and better decisions. The pandemic exposed weaknesses when semiconductor shortages stalled cars, phones, and gaming gear; that example shows why you must diversify and plan.
Across industry, leaders who blend efficiency with robust planning protect service levels and revenue. In the sections that follow, you’ll get a clear playbook of strategies for forecasting, inventory, supplier choices, and risk-aware sourcing so your team can act confidently.
Key Takeaways
- You’ll get a simple definition of why resilience matters to your customer promises.
- Learn four foundational pillars that reduce real-world risk and boost performance.
- See how AI, blockchain, digital twins, IoT, cloud, and RPA improve situational awareness.
- Connect pandemic-era lessons to current planning so products don’t stall.
- Preview a practical playbook for forecasting, sourcing, and inventory choices.
- Align outcomes to on-time delivery, fill rates, and revenue protection.
What Supply Chain Resilience Means Today (and Why It Matters in the present)
Modern robustness is less about hoarding stock and more about smart, targeted protection.
Supply chain resilience now means calibrating buffers, optionality, and response speed to the actual risks your business faces. Good planning uses predictive analytics and real-time information to keep service high without bloating working capital.
You must balance efficiency—lean inventories and tight cycles—against exposure from long lead times or single-source suppliers. Use a simple decision lens: bias toward protection for high-variance or differentiated parts, and favor efficiency for stable commodities.
Early wins come from closing visibility gaps and monitoring supplier performance. Those fixes often improve on-time delivery, protect revenue, and raise customer satisfaction.
“Predictive analytics let you trim excess where risk is low and build contingency where risk is high.”
Organizational challenges—siloed systems and legacy tools—limit end-to-end view and slow responses. Governance that couples metrics with targeted adjustments prevents costly blanket reactions and helps you explain trade-offs to finance and sales.
- Define risks and right-size safety stock.
- Use real-time data to protect service without excess cost.
- Translate changes into measurable impact on operations and market outcomes.
How Disruptions Propagate Across Global Supply Chains
A single supplier failure can ripple through networks, halting production lines and shrinking revenues across multiple tiers.
What follows is a simple map of that transmission and the signals you can watch to act early.
Downstream and upstream shock transmission
When one firm goes offline, downstream customers often face delays or stoppages. Upstream vendors then see orders and sales drop.
“A 2016 study found that $1 lost by an impacted firm led to about $2.40 lost by its customer firms.”
After the 2011 Great East Japan earthquake, half of the total economic impact came from effects reaching firms up to four degrees away. Differentiated or R&D-heavy inputs amplify the problem because substitutes are scarce.
From COVID-19 to natural disasters
The New York Fed’s Global Supply Chain Pressure Index jumped in early 2020, eased mid-year, then peaked in December 2021 as demand rebounded and transportation bottlenecks lasted.
- Map cascading failures to see which products face the greatest exposure.
- Use the GSCPI to time mitigation moves for long-lead items.
- Trigger monitoring for demand spikes, constrained capacity, and industry-specific risks.
Supply Chain Resilience
Real-world robustness rests on four actions you can embed into daily operations.
The four pillars: contingency, flexibility, visibility, collaboration
Contingency means backup suppliers, alternate routes, and emergency inventory for critical parts. These policies stop a single failure from becoming a business halt.
Flexibility focuses on modular production, cross-trained teams, and supplier agreements that let you shift capacity fast.
Visibility comes from multi-tier mapping, event monitoring, and a control-tower view that spots risks before they reach your customer.
Collaboration uses scorecards, joint S&OP, and shared data platforms so partners act on the same signals.
Turning pillars into practice: From policies and buffers to shared data
- Set buffer rules for critical goods and decide where flexible capacity replaces stock.
- Define escalation paths and clear decision rights so teams act fast.
- Align incentives with SLAs and gainsharing so partners share costs and rewards.
- Use customer segmentation to apply stronger protections where service matters most.
“Shared data platforms let you detect risks early and respond before customers feel the impact.”
Your Risk Landscape: Identifying Vulnerabilities Before They Amplify
Identify the few components and suppliers that, if disrupted, would stop your key products. Start by tagging parts that are differentiated or R&D‑intensive. Those are the items with long lead times and few substitutes.
Map to prioritize action. Score each item on single‑source exposure, geographic concentration, and time‑to‑replace. Combine that with BOM and product‑family analysis to spot where one fragile part risks whole orders.
Assess supplier health using simple signals: quality trends, on‑time delivery, and financial stability. Look beyond direct vendors into multi‑tier links to find hidden choke points.
“Firms that pre‑qualified alternates and simplified specs during COVID‑19 kept production running and secured replacements faster.”
Turn analysis into action
- Inventory critical inputs and flag hard‑to‑replace materials and products.
- Quantify business impact if a key input fails, including customer promises and regulations.
- Define early‑warning indicators and add findings to a risk register with owners and budgets.
Use past data to see which items failed most often and where optionality pays off. Package results into an actionable register so you can trigger contingency sourcing before problems amplify.
Strategy Playbook: From Forecasting to Inventory and Supplier Diversification
Build a practical playbook that links demand signals, inventory policy, and supplier options for quicker responses. This section gives short, actionable steps you can use today.
Demand forecasting and safety stock: Moving beyond JIT to just-in-case where it counts
Effective forecasting needs visibility across the entire supply chain. Use AI-driven demand sensing and consensus forecasting to reduce bias and improve service.
Keep targeted safety stock for volatile or critical products while running lean where demand is stable. Link inventory rules to service targets and margin goals so you balance costs and availability.
Supplier relationships and performance monitoring: Quality, delivery, capacity
Formalize supplier dashboards that track quality escapes, on-time delivery, and capacity headroom. Share these metrics via a common data platform so you spot trouble early.
Strengthen relationships with strategic vendors through joint business plans, capacity reservations, and collaborative S&OP to secure surge capacity when needed.
Dual sourcing, nearshoring, and multisourcing to reduce regional exposure
Reduce regional risk with dual sourcing, nearshoring, and multisourcing aligned to your risk map. Pre-qualify alternates and standardize specs to speed switches.
- Integrate logistics partners into shared platforms to flag transit risks and reroute proactively.
- Use should-cost and total landed cost models to choose the right sourcing mix for each product.
- Create contract clauses for surge capacity and expedited delivery to improve response agility.
“You’ll recalibrate planning using AI-enhanced demand sensing and consensus forecasting to reduce bias and improve service.”
Technology Enablers for Resilient Supply Chains
Technology now gives you tools to spot disruption hours — not days — before customers feel a gap.
Use smart platforms to turn signals into fast, reliable action. AI and ML power predictive analytics so you can forecast demand shifts and flag supply risks. That lets you automate replenishment thresholds and keep service high without excess stock.
Blockchain and traceability
Use blockchain-ledgers to verify provenance and speed investigations when quality issues arise. Immutable records reduce fraud and speed recalls, helping partner trust across industries.
Digital twins, IoT, cloud, and RPA
Build digital twins to simulate port closures, supplier loss, or demand spikes and pick robust strategies without disrupting operations.
IoT sensors feed condition and location data to cloud platforms so teams share the same information in real time. RPA then automates routine tasks — order entry, ASN checks, and exception routing — to cut cycle time and human error.
- AI/ML: forecast shifts, flag risks, automate replenishment.
- Blockchain: verify provenance and accelerate investigations.
- Digital twins + IoT: test scenarios and monitor assets live.
- Cloud + RPA: centralize data, automate workflows, and shorten response times.
“Integrate these tools into daily workflows so planners act on insights, not just dashboards.”
Sequence pilots on high-variance categories and critical nodes. Measure returns by reduced stockouts, lower expedite fees, and better on-time delivery to the customer. With clear data governance, you scale fast and keep your operations steady when shocks arrive.
Policy, Industrial Strategy, and the New Geography of Global Supply
Federal incentives and trade deals are rewriting the economics of making critical parts close to home. You need to understand how those moves change costs, location decisions, and partner choices for your products.
CHIPS, the IRA, and IIJA direct nearly $430B of recent manufacturing investment and shift where high-tech and clean industries cluster.
CHIPS funds $52.7B plus a 25% tax credit for semiconductors. IRA credits and procurement rules favor low‑embodied‑carbon inputs. Intel’s $20B Ohio plan and Taiwanese fabs in the U.S. show how ecosystems co-locate fast.
Reshoring and friend‑shoring: What CHIPS, IRA, and IIJA mean for you
Map grants and tax credits to your product roadmap and capex plans. Where credits apply, near‑term cost models can flip in favor of domestic capacity.
USMCA and targeted trade agreements
USMCA coincided with 134% FDI growth into North America since 2020. Mexico’s Q1 2023 FDI rose ~48% year‑over‑year, over half in manufacturing.
Tariffs and government incentives: How policy reshapes sourcing decisions
- Model total landed cost: include tariffs, incentives, and compliance overhead.
- Pre‑qualify parts: identify components that qualify for credits or preferred procurement.
- Contract safeguards: lock incentive terms and protect against policy shifts.
“Policy incentives can make nearby suppliers cheaper — but you still must weigh dependency and long‑term risks.”
Build a decision tree that balances policy benefits against market exposure and operational risks. That will help you capture incentives while keeping options open.
Costs, Labor, and Logistics: Navigating the Trade-offs
Rising wages and volatile freight rates are forcing you to rethink where and how you make products. Small shifts in pay or transport can flip sourcing decisions, so measure total landed cost, not just hourly rates.
Labor arbitrage is shifting
Update your benchmarks: Chinese manufacturing wages rose from about 3% of U.S. levels in 2003 to roughly 26% by 2022–2023. Mexico moved from ~11% to ~14%, India sits near 4–5%, Malaysia ~1%, and Thailand ~15%.
These moves change where production looks cheapest. You’ll re-evaluate nearshoring to Mexico for automotive and electronics as policy and cost dynamics shift competitiveness.
Shipping and transportation volatility
Ocean rates can reshape your math overnight. On Feb 1, 2024, China–U.S. East Coast hit $6,589/FEU — a 193% jump since Oct 2023.
Build logistics contingency plans: carrier diversification, forward contracts, modal shifts, and playbooks for port disruptions and delays.
Automation and smart factories
Automation and smart factories shrink labor’s share of cost. That changes make/buy and location choices as robotics and digital tools raise productivity.
Model automation’s impact on total cost, quality, and time-to-market before you relocate production.
“Quantify total landed cost — include tariffs, incentives, logistics, inventory carrying, and quality — not just hourly wages.”
- Update labor cost benchmarks and test location scenarios.
- Incorporate the early‑2024 freight spike and NAM raw material outlook (+2.38%) into your sensitivity models.
- Create switching thresholds so operations and finance can act when cost or service breach limits.
For deeper thinking on greener, policy-aware sourcing, see green supply chains.
Measuring Resilience: Time-to-Survive, Time-to-Recover, Time-to-Thrive
Quantify three time horizons—survive, recover, and thrive—to make trade-offs explicit and fundable. These measures show how long your network and products keep serving customers, how fast you bounce back, and when you can capture upside after disruptions.
Time-to-survive (TTS) is how long you operate without severe setbacks. Calculate TTS by SKU family using buffer stock, alternate capacity, and reroute options.
Time-to-recover (TTR) is how quickly you return to normal. You shorten TTR with supplier alternates, standardized changeovers, and pre-negotiated expedite terms.
Time-to-thrive (TTT) tracks how fast you pivot to growth and win share while competitors lag. Build TTT metrics that capture regained fill rate, OTIF, and backlog recovery.
- Define TTS, TTR, TTT scenarios and assumptions by plant, lane, and product family.
- Link targets to customer KPIs so continuity and impact are visible to leadership.
- Use control-tower data and ERP actuals to compare targets and trigger corrective actions.
- Report these KPIs alongside cost to make investment cases for stock, tooling, and tech.
- Benchmark across sites and suppliers and fold results into QBRs and scorecards.
“Measure what matters: tie recovery times to customer promises and financial trade-offs.”
Your Roadmap to Build a Resilient Supply Chain
Lay out a short, practical path: diagnose, shore up options, then automate and improve. This three‑phase roadmap helps you turn risk findings into measurable outcomes without overpaying for protection.
Phase 1: Risk mapping, data foundation, and quick wins
Start by mapping critical inputs, multi‑tier exposure, and single‑source risks so you spot the biggest threats fast.
Fix masters, unify planning calendars, and stand up a basic control tower for visibility. Then execute quick wins: alternate‑qual for high‑risk SKUs, targeted safety stock, and carrier diversification.
Phase 2: Supplier diversification, inventory redesign, and policy-aligned sourcing
Formalize dual sourcing and nearshoring moves to match the 81%/80%/44% industry trends. Redesign inventory by segment (A/B/C) to meet service targets at the right working capital.
Align sourcing to capture CHIPS/IRA/IIJA and USMCA incentives while keeping optionality and deepening relationships via capacity reservations and shared scorecards.
Phase 3: Technology scaling, digital twins, and continuous improvement
Scale AI/ML, digital twins, blockchain, IoT, cloud, and RPA to automate sensing and response. Use TTS/TTR/TTT metrics, supplier QBRs, and post‑mortems to embed continuous improvement.
- Govern the roadmap with stage gates and benefits tracking.
- Measure ROI and adjust priorities every quarter.
- Keep suppliers close with shared data and repeatable playbooks.
Conclusion
Build practical defenses across sourcing, inventory, and technology to turn uncertainty into manageable risk.
The push for supply chain resilience reflects a trade-off between stability and cost. Policy moves like reshoring, tariffs, and incentives can raise input prices short term, yet they remain priorities as climate and geopolitics add pressure.
Benefits are clear: continuity, faster recovery, better agility, and long‑term cost optimization that often offsets early price upticks.
You’ll leave with a simple mandate: apply targeted strategies where exposure is highest, keep efficiency where it pays, and govern investments with TTS/TTR/TTT metrics.
Prioritize multi‑tier visibility, supplier diversification, and shared data so your teams act fast and protect customers and brand when disruptions arrive.