Supply chain resilience is your ability to keep delivering to customers when something in your network breaks. A supplier goes offline, a port closes, a tariff lands overnight: resilience is what decides whether that becomes a bad week or a lost quarter.
It is not the same as holding more stock. Resilience means knowing which parts of your network would actually hurt you, and protecting those points instead of padding everything.
This guide covers how disruptions spread, where your weak points sit, which supply chain resilience strategies and technologies genuinely help, and how to measure whether any of it worked. The examples come from what companies faced in 2026, which was not a quiet year.
Key Takeaways
- Resilience means protecting your customer promises, not maximising inventory everywhere.
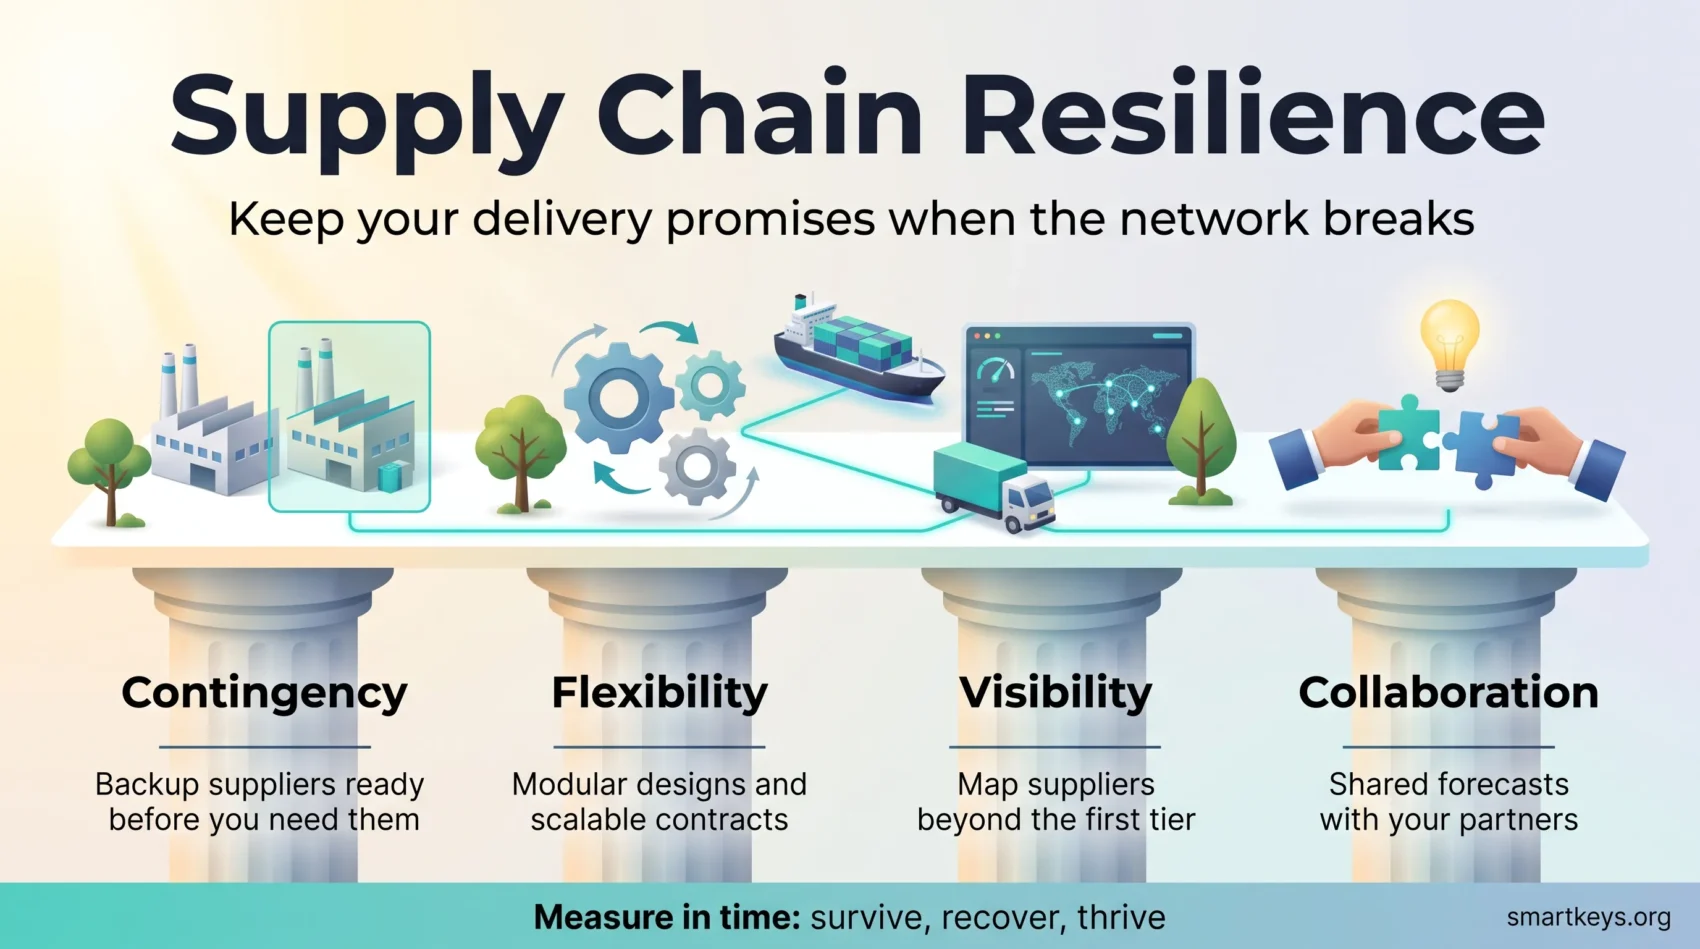
- Four pillars carry the work: contingency, flexibility, visibility, and collaboration.
- Most damage comes from a small number of parts with long lead times and few substitutes.
- Supply chain pressure hit a four-year high in April 2026, so older planning assumptions no longer hold.
- AI attracts most of the technology budget, yet more than half of supply chain chiefs cannot show what it returned.
- Measure resilience in time: how long you survive, how fast you recover, how quickly you grow again.
What Supply Chain Resilience Means in 2026
Ten years ago, the standard answer to risk was more warehouse space. That answer is too blunt and too costly now. The better question is narrower: which specific failures would stop you serving customers, and what is the cheapest way to survive each one?
So treat your parts list as two groups. Stable commodities with several suppliers and short lead times can stay lean. A custom component with one qualified supplier and a six-month lead time needs real protection, whether that is a second source, a buffer, or a redesign that removes the dependency. A furniture maker buying screws does not need a contingency plan for screws. The same company buying one specific motor from one factory does, because when that motor stops arriving, every finished product stops with it.
Two things give you most of the early benefit. The first is visibility: knowing where your inputs actually come from, including the suppliers of your suppliers. The second is supplier monitoring, watching quality, delivery reliability and financial health closely enough that trouble shows up before a missed shipment does. Both are cheap compared with the stock they let you avoid carrying, and both sit at the heart of the wider trends reshaping supply chain management.
The usual obstacle is not money. It is that purchasing, planning and logistics each hold part of the picture in a different system, so nobody sees the whole network. Fixing that needs a shared data foundation and agreed ownership, the same work described in any serious data governance strategy.
How Disruptions Spread Through a Supply Chain
A disruption rarely stays where it started. One factory halts, its customers run short, and their customers miss delivery dates. The effect spreads through firms that may not know they share a supplier.
Why one failure becomes many
Two features decide how far the damage travels. The first is substitutability: a standard fastener can be bought elsewhere within days, while a part designed for your product cannot. The second is depth, because you may be exposed through a supplier you have never contracted with, three tiers below your direct vendor.
That is why mapping only direct suppliers gives false comfort. The choke point is often a single specialised plant sitting behind a dozen of your vendors at once. Industries learned this during the semiconductor shortage, when car makers, phone manufacturers and games console brands all queued for capacity from the same handful of fabs.
What the pressure gauge showed in 2026
The New York Fed publishes the Global Supply Chain Pressure Index, or GSCPI, a single number that combines shipping costs and delivery delays across major economies. A reading of zero means conditions are average by historical standards. Higher readings mean the system is strained.
The index climbed to 1.82 in April 2026, up from 0.55 in February and 0.68 in March, its highest level since July 2022. New York Fed President John C. Williams described sharp increases in delivery times and input prices, comparing conditions to the post-pandemic squeeze of 2021 (PYMNTS on New York Fed data).
Use the index for timing. When pressure rises, long lead time items slip first, so that is when you place cover orders and confirm alternates. When it falls back, unwind the extra stock rather than letting it become permanent working capital. Treat it as one input to a broader risk management framework, not a forecast on its own.
The Four Pillars: Contingency, Flexibility, Visibility, Collaboration
Resilience sounds abstract until it is broken into actions. These four cover most of it.
Contingency is having a second option ready before you need it: qualified backup suppliers, alternate shipping routes, and emergency stock for the parts you identified as critical. Qualified matters, because a supplier you have never bought from is a phone number, not a plan.
Flexibility is being able to change course quickly. Modular designs that accept more than one component, cross-trained staff who can move between lines, and contracts that scale volumes up or down without penalty all buy you time.
Visibility is seeing problems while they are still small. That means mapping suppliers beyond the first tier and running what logistics teams call a control tower: one dashboard pulling order, shipment and supplier data into a single view. Connected sensors feed it directly, one of the clearest wins in IoT for business.
Collaboration means your partners see the same signals you do. Shared forecasts, joint planning meetings and supplier scorecards turn a chain of separate companies into something closer to one team.
Turning the pillars into daily practice
- Write buffer rules per product family, and state where flexible capacity replaces stock.
- Define who may trigger a contingency plan and at what threshold, so nobody waits for a meeting.
- Tie supplier incentives to service levels, and share the savings when performance improves.
- Give the strongest protection to the accounts and products that matter most.
Find Your Weak Points Before They Break
You cannot protect everything, so decide what deserves protection. The answer is usually a short list: components that are hard to replace and sit inside products you cannot afford to stop shipping.
Score each critical input on three questions. Does it come from a single source? Is that source concentrated in one region? How long would it take to qualify a replacement? Cross that with your bill of materials, the parts list behind each product, so you can see which finished goods depend on which fragile input.
Then check supplier health using signals you already collect: quality trends, on-time delivery, and financial warning signs. Extend the check past your direct vendors, because hidden choke points sit deeper in the network. Digital procurement tools make this far less manual than it used to be.
A three-step method you can run this quarter
- List your critical inputs and flag the ones that are hard to replace.
- Estimate the business impact if each failed, including penalties and regulatory obligations.
- Define early warning signals, and record them in a risk register with a named owner and budget.
Use your own history as evidence. Parts that caused trouble before usually cause it again, and the record shows where a second source would have paid for itself. The same logic applies to people, which is why workforce contingency planning belongs in the same review.
The Risk Mitigation Playbook: Forecasting, Inventory and Supplier Choices
Forecasting and safety stock
Just-in-time, or JIT, means ordering so materials arrive as you need them, which minimises stock but leaves no slack. Just-in-case means deliberately holding a buffer. The useful position is neither: run JIT for stable, easily replaced items, and hold buffers only where a shortage would stop production.
Better forecasting shrinks the buffer you need. Demand sensing corrects the forecast continuously from recent orders, point-of-sale data and external signals instead of monthly. Consensus forecasting brings sales, marketing and operations to one number rather than three competing ones, which removes a surprising amount of built-in bias.
Link every inventory rule to a service target. If you cannot say which delivery promise a buffer protects, you are holding stock out of habit.
Supplier performance monitoring
Build a simple supplier dashboard covering quality problems, on-time delivery and spare capacity, then share it with the supplier. Most performance conversations improve the moment both sides look at the same numbers.
For strategic vendors, go further. Joint business plans, reserved capacity and shared sales and operations planning, the monthly cycle where demand and supply plans are agreed together, buy you priority when capacity is tight. That is worth more than a small price concession.
Dual sourcing, nearshoring and multisourcing
Three related moves reduce concentration risk. Dual sourcing qualifies a second supplier for the same part. Nearshoring moves production closer to your market, for example from Asia to Mexico or Eastern Europe. Multisourcing spreads volume across several suppliers, so no single failure takes out your whole supply.
Companies are acting on this. A 2026 Manufacturers Alliance survey found 57% of manufacturing CEOs actively relocating or restructuring supply chains, with 80% naming higher cost pressure as their main short-term challenge from trade policy (Manufacturers Alliance).
Three habits keep these moves useful rather than merely expensive:
- Pre-qualify alternates before you need them, and standardise specifications so switching does not require a redesign.
- Bring logistics providers onto the same data platform, so transit problems surface early enough to reroute.
- Compare options on total landed cost, which includes duties, freight, inventory carrying cost and quality risk, not on unit price.
Technology That Actually Helps
Technology is where resilience budgets go, and where they most often vanish without trace. Gartner surveyed 394 supply chain professionals between November 2025 and February 2026 and found 67% of digital investment going to AI. A parallel survey of 135 senior leaders found 55% of chief supply chain officers unclear on what that spending returned (Gartner).
The lesson is not to avoid the technology but to start from a specific blind spot and measure the result, the same discipline that separates useful from decorative AI in business operations.
Prediction and automation
Machine learning is good at two jobs here: spotting demand shifts earlier than a monthly cycle would, and flagging suppliers whose delivery pattern is quietly degrading. Both let you act while options are still cheap.
Routine work can be handed off too. Robotic process automation, or RPA, is software that performs repetitive digital tasks such as entering orders, checking shipping notices or routing exceptions to the right person. It removes typing errors and shortens response time, the everyday end of business automation.
Traceability and provenance
Knowing exactly where a batch came from matters when a quality problem appears, and increasingly when regulators ask. A shared, tamper-evident record across partners speeds up recalls and narrows their scope, which is the practical case for blockchain in logistics. Gartner named product provenance a top supply chain technology trend for 2026, alongside physical AI and agentic systems (Gartner). Agreements that release payment automatically once delivery conditions are met belong to the same family, covered under smart contracts in business.
Digital twins and connected equipment
A digital twin is a working model of your network that you can run experiments on. Close a port, remove a supplier, double demand, and see what breaks without touching real operations. The approach matured fastest in production environments, as covered in digital twins in manufacturing.
Connected equipment feeds the same picture. Sensors report location, temperature and machine condition in real time, supporting both live tracking and predictive maintenance, where you service a machine before it fails. On the factory floor, private mobile networks make this reliable at scale, as explained in 5G in manufacturing.
Two supporting pieces are easy to forget. All of this needs somewhere to run, a question of cloud strategy, and all of it widens your attack surface, which makes supplier security part of your own cybersecurity posture.
Start with one high-variance category and one critical node. Measure the result in stockouts avoided, expedite fees not paid and on-time delivery gained. If those numbers do not move, the pilot has still told you something.
Trade Policy in 2026: Tariffs, Reviews and Incentives
Policy moved faster than most sourcing plans in 2026, changing the arithmetic of where to build.
Tariffs are the clearest example. The average effective US tariff rate reached 7.7% in 2025, the highest since 1947, against 2.4% in 2024. In February 2026 the Supreme Court struck down the tariffs imposed under the International Emergency Economic Powers Act, and importers were owed refunds on what had been collected. The effective rate stood at 7.2% in 2026 (Tax Foundation). The pattern matters more than the number: duty rates are now a moving input to sourcing decisions, not a fixed background cost.
North American trade rules also shifted. At the mandatory six-year joint review on 1 July 2026, the United States declined to renew the USMCA in its current form, while Mexico and Canada each supported a 16-year extension. All current preferences and rules of origin still run until 1 July 2036, but the parties must now review the agreement every year (White & Case). For anyone weighing a plant in Mexico, that is a recurring decision point rather than a settled framework.
Incentives pull the other way. The CHIPS Act, the Inflation Reduction Act and the infrastructure programme attach grants, tax credits and procurement preferences to domestic production, particularly in semiconductors and low-carbon inputs. Where those credits apply, a domestic option that looked expensive on unit cost can win on total cost.
Three practical responses:
- Model total landed cost with duties, incentives and compliance overhead, and rerun it when rules change.
- Identify which components qualify for credits or preferred procurement before you commit to a location.
- Write contract terms that lock in incentive treatment and share the risk if policy shifts.
Environmental rules belong in the same calculation, because carbon reporting and product requirements now shape supplier selection in several markets. That overlap is covered in green supply chains, circular economy manufacturing and any ESG framework.
Costs, Labor and Logistics
Two cost lines move often enough to overturn a sourcing decision: wages and freight.
Labor arbitrage has narrowed. The wage gap that justified long supply chains in the 2000s is much smaller today, and in several manufacturing hubs it keeps closing. That does not make offshore sourcing wrong, but a decision based on a decade-old wage comparison is probably out of date. Automation shifts the balance again, because when robots do more of the assembly, labor is a smaller share of unit cost and location matters less. That is the practical argument in robotics and automation.
Freight rates and the Red Sea return
Ocean freight is the volatile half. Spot rates can double or halve within months, so a model built on one year’s rates will mislead you. The Red Sea is the live example. After years of diversions around southern Africa, carriers began returning to the Suez Canal during 2026. Maersk and Hapag-Lloyd resumed transits, CMA CGM moved 199 vessels through the canal over the year, and MSC restored Suez services on selected east-west routes on 25 August 2026 (The Maritime Executive). Shorter routings cut Asia to Europe transit times, changing both your inventory in transit and your rate expectations.
Build a logistics contingency plan rather than a rate forecast: more than one carrier, a mix of contract and spot coverage, a mode you can switch to, and a written playbook for port closures. Local production is another lever, since printing a spare part on site can remove the shipment entirely, as discussed in 3D printing and supply chains.
Set switching thresholds in advance, so when cost or service crosses an agreed line, operations and finance already know what happens next.
Measuring Resilience: Time to Survive, Recover, Thrive
Resilience is easiest to fund when measured in time. Three numbers do most of the work.
Time to survive is how long you can keep serving customers after a given failure, using buffers, alternate capacity and rerouting. Calculate it per product family, because the answer differs enormously between products.
Time to recover is how long it takes to return to normal output. You shorten it with qualified alternates, standardised changeovers and expedite terms agreed before you need them.
Time to thrive is how quickly you return to growth while competitors are still catching up. Measure it through recovered fill rate, on-time in-full delivery and backlog clearance.
- Define each measure per plant, lane and product family, and write down the assumptions behind it.
- Connect the targets to customer commitments, so leadership sees the business consequence.
- Compare targets with actual data after each incident, and correct the assumptions.
- Report them alongside cost, so investment in stock, tooling and technology is argued on one page.
A Three-Phase Roadmap
Phase 1: Map the risk and take the quick wins
Map critical inputs, multi-tier exposure and single-source risks. Clean up master data, align planning calendars, and stand up a basic control tower so everyone sees one version of the truth. Then take the obvious wins: qualify alternates for your highest-risk items, add targeted safety stock, and sign a second carrier.
Phase 2: Diversify suppliers and redesign inventory
Formalise dual sourcing and any nearshoring moves. Redesign inventory by segment, so high-risk items get protection while the long tail stays lean. Align sourcing with available trade incentives, and deepen strategic relationships through reserved capacity and shared scorecards.
Phase 3: Scale the technology and keep improving
Extend the tools that proved themselves earlier, from demand sensing to digital twins and automated exception handling. Run post-incident reviews, track time to survive and recover against target, and revisit priorities each quarter. Stage gates and benefits tracking stop pilots multiplying without ever scaling.
Conclusion
Supply chain resilience is a series of specific choices, not a posture. Protect the few inputs whose failure would stop you serving customers, stay lean everywhere else, and buy visibility before you buy inventory. Knowing about a problem early is almost always cheaper than absorbing it late.
The 2026 backdrop makes the case on its own. Pressure readings hit a four-year high, a court overturned a major tariff programme mid-year, a large trade agreement moved to annual review, and shipping lanes reopened after years of detours. None of that was forecastable, and all of it was survivable for companies that had options ready.
Measure the outcome in time to survive, time to recover and time to thrive. Those three numbers turn resilience from an argument about caution into a decision finance can price.
Found this useful?
Make SmartKeys a preferred source on Google, and our articles will surface more often in your Top Stories, AI Overviews, and AI Mode.
Add as Preferred Source