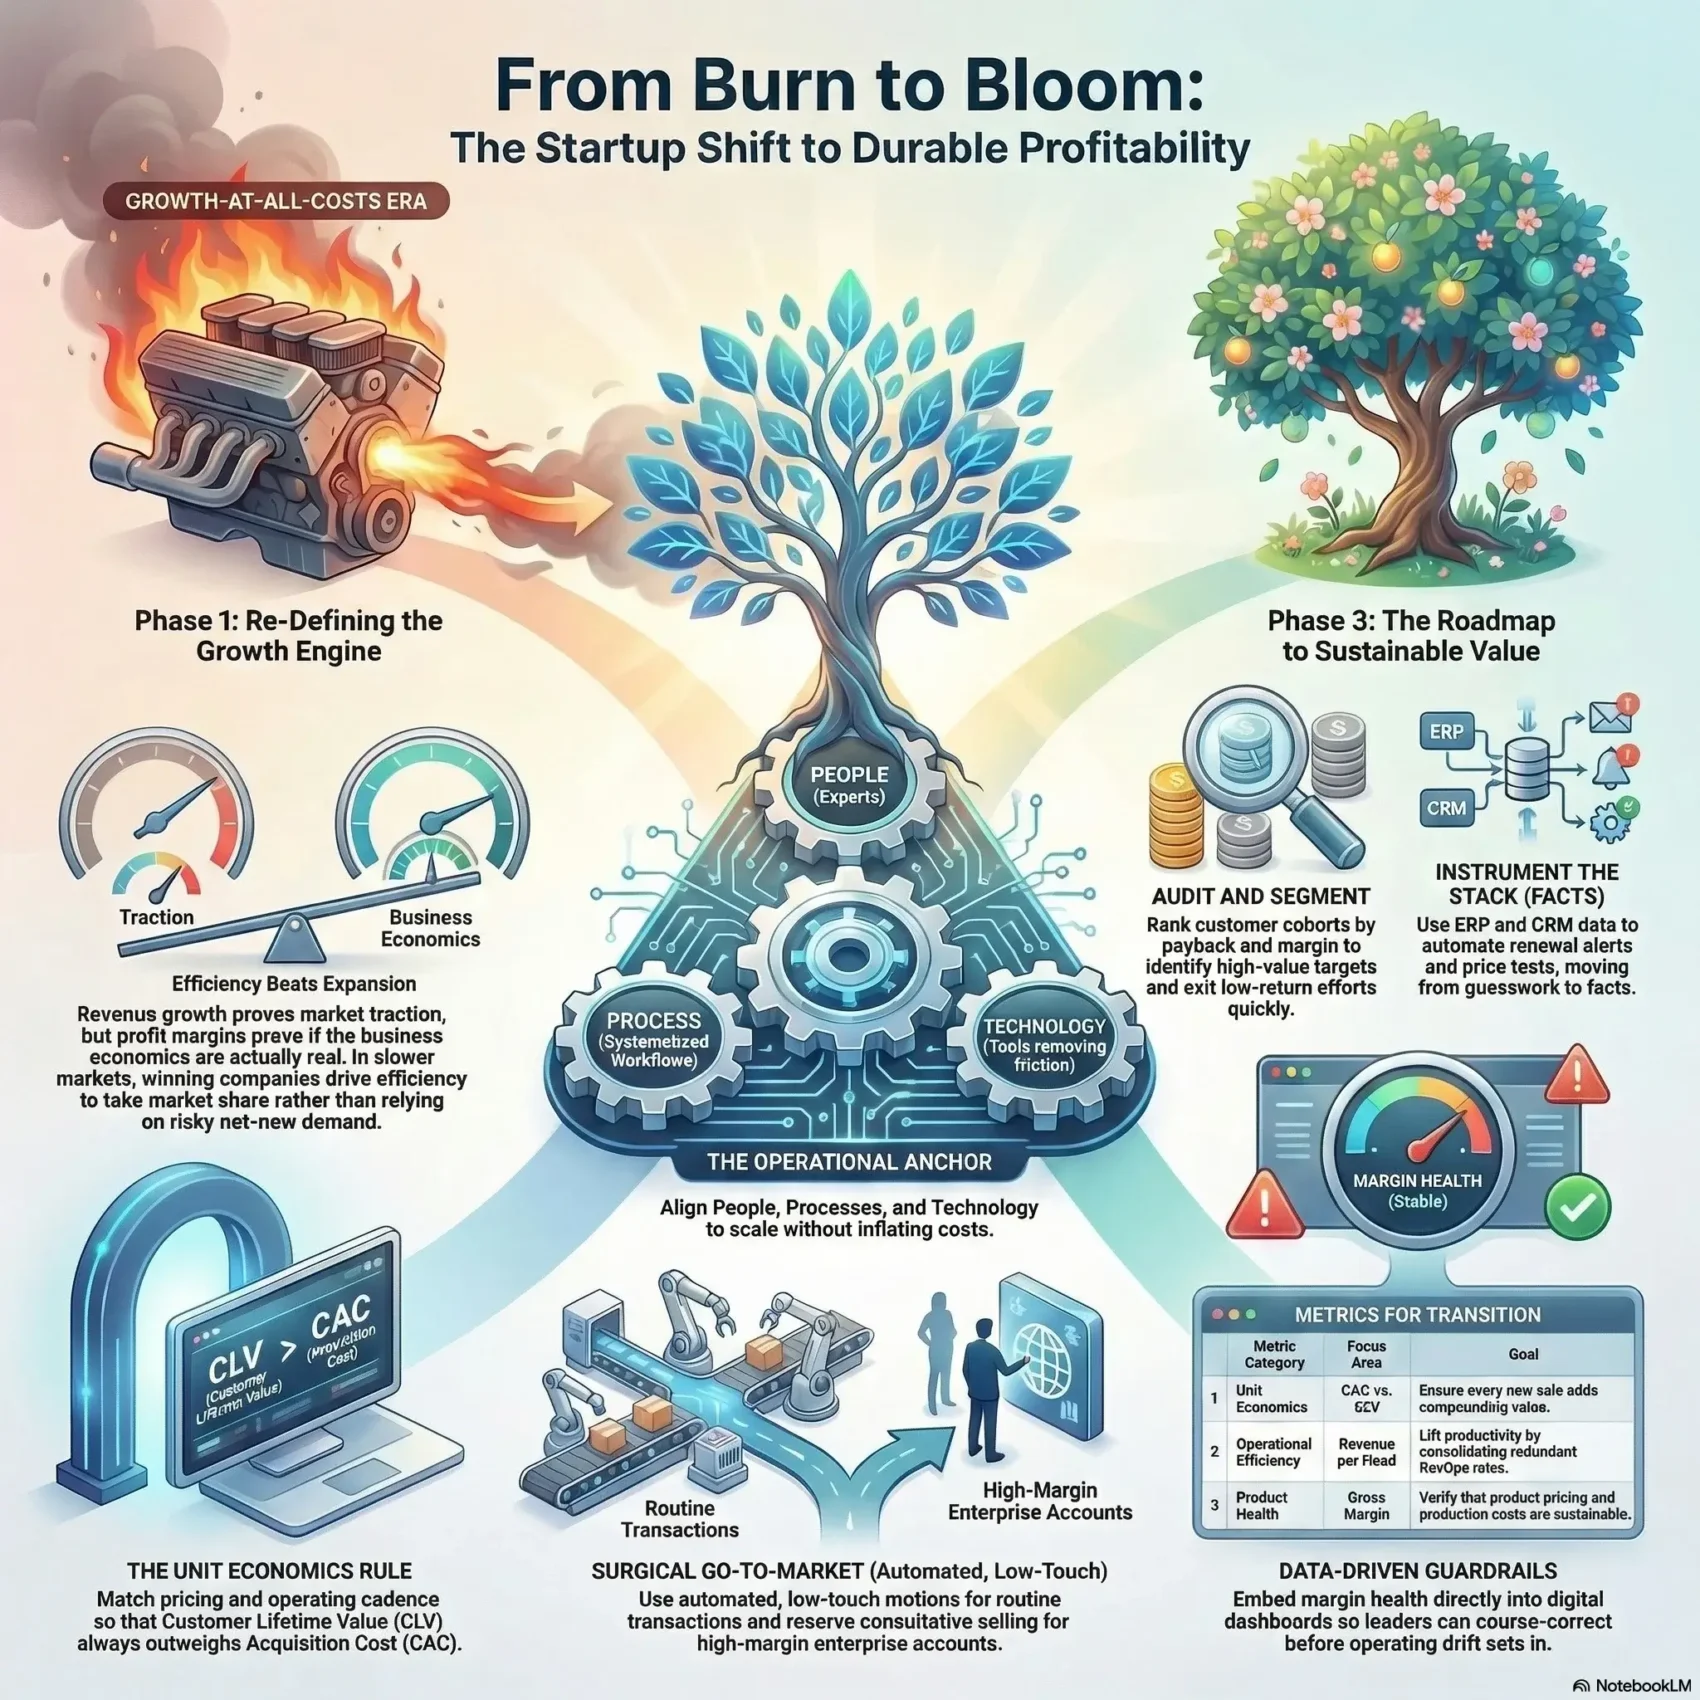
Most startups now have to show they can make money before anyone hands them more of it. That is the shift behind the phrase “profitability focus”. Instead of buying growth with investor cash and worrying about margins later, companies build a business that pays for its own expansion.
This is not a lecture about frugality. It is a response to where the money actually went. In the first half of 2026, US venture investors deployed $412.7 billion. But 86% of those dollars went to artificial intelligence companies, and 87.5% went into deals of $100 million or more, according to the Q2 2026 PitchBook-NVCA Venture Monitor. The report describes a market “setting records at the very top while contracting in almost every other segment underneath it”. If your company is not one of the few at the top, capital is far harder to reach than the headline figure suggests. Our overview of current startup funding trends covers that split in more detail.
The consequence shows up in how companies die. CB Insights reviewed 431 venture-backed startups that shut down from 2023 onward. Running out of capital appeared in 70% of cases, poor product-market fit in 43%, and unsustainable unit economics in 19%. The median company had raised $11 million before closing. Cash is usually the last cause of death, not the first.
This article explains what a profitability focus looks like in practice: the five numbers that show whether growth pays for itself, how to redesign sales coverage around margin, and how to audit the business without cutting the spending that keeps it alive.
Key Takeaways
- Profitability focus means growth that funds itself. It does not mean growth stops.
- Venture money in 2026 is concentrated in AI and in very large deals, so most companies now fund expansion from revenue.
- Five numbers do most of the work: gross margin, CAC payback, net revenue retention, burn multiple and the Rule of 40.
- Match sales coverage to account value. Expensive salespeople on small accounts quietly destroy margin.
- The common failure is cutting too deep, because some spending is simply the cost of next year’s revenue.
What a profitability focus actually means
Profit is what is left after you pay for everything it took to earn the revenue. That sounds obvious, but growth-stage companies routinely track only the first half of the sentence.
Three terms do most of the work, and they are worth separating clearly.
Gross margin is revenue minus the direct cost of delivering the product: hosting, payment fees, support staff, third-party licenses. It answers one question. Does the thing you sell make money before you pay for offices, salespeople and engineers?
Operating margin subtracts everything else. It tells you whether the whole company, not just the product, runs at a surplus.
Cash flow is different from both. You can be profitable on paper and still miss payroll, because customers pay in 60 days while your suppliers want 30. A practical guide to cash flow management is worth more to an early company than another dashboard of revenue charts.
Here is the difference in one example. A software company bills $100,000 a month. Hosting, support and payment processing cost $25,000, so gross margin is 75%. Sales, marketing, engineering and admin cost another $90,000. The product is healthy; the company is losing $15,000 a month. The fix is not “sell more” in the abstract. It is either cheaper customer acquisition or higher prices, and you cannot tell which without the numbers below.
Why the shift happened: where the money went
Growth-at-all-costs was a rational strategy when capital was cheap and plentiful. If an investor will fund your losses for five years while you take a market, spending ahead of revenue is the right call. That bargain has narrowed sharply.
The 2026 funding data shows why. Three firms captured 48.1% of all capital raised by US venture funds, and first-time fund formation is tracking toward its lowest level since 2016. Fewer new funds means fewer checks for companies outside the obvious categories. For most founders, the next round is now slower, smaller and more conditional than the last one.
Buyers have changed too. Software budgets are scrutinized, procurement asks harder questions, and renewal is no longer automatic. That makes retention an economic issue rather than a customer-service one, and our guide to customer retention strategies goes through the mechanics.
The five numbers that show whether growth pays for itself
You do not need a finance team to run these. Five figures, reviewed monthly, will tell you more than a 40-tab model.
1. Gross margin: does the product itself make money?
Calculate revenue minus direct delivery costs, divided by revenue. Software businesses usually aim high because the cost of serving one more customer is small. Services-heavy businesses sit lower, and that is fine as long as you price for it.
If gross margin is falling while revenue rises, you are selling more of something that costs you more to deliver. That is often infrastructure. Cloud cost optimization and disciplined FinOps practices attack that cost line directly.
2. CAC payback: how long until a customer repays what you spent to win them
Customer acquisition cost, or CAC, is total sales and marketing spend divided by the number of new customers it produced. CAC payback is how many months of that customer’s gross profit it takes to earn that spend back.
Suppose you spend $12,000 to win a customer who pays $1,000 a month at 75% gross margin. Each month returns $750, so payback takes 16 months. Until month 16, that customer has cost you money. Multiply by every deal in the quarter and you can see why a fast-growing company can run out of cash.
Shorter payback is the single most useful lever most companies have. It comes from better targeting, higher prices or cheaper channels, and rarely from telling the sales team to work harder.
3. Net revenue retention: does the base grow on its own?
Take the revenue from a group of customers a year ago. Compare it with what those same customers pay today, after cancellations, downgrades and upgrades. Above 100% means the existing base grows without a single new logo.
This is the number that separates a business that compounds from one that refills a leaking bucket. It is also the one most improved by customer success tools and by resolving problems before renewal season.
4. Burn multiple: how much cash you spend per dollar of new revenue
Divide net cash burned in a period by net new annual recurring revenue added in the same period. A burn multiple of 1 means you spent a dollar to add a dollar of recurring revenue. A burn multiple of 4 means you spent four.
The metric is blunt on purpose. It catches inefficiency wherever it hides: an oversized team, a discount habit, a channel that no longer converts.
5. The Rule of 40: one number for the trade-off
Add your annual revenue growth rate to your profit margin. Investors have long used a combined score of 40 as a rough marker of a healthy software business. A company growing 60% while losing 20% clears it. So does one growing 15% with a 25% margin.
Treat it as a conversation starter, not a target. It cannot tell a margin earned through efficiency from one bought by stopping all investment. But it does force the trade-off into a single line a board can discuss.
Getting these five figures into one reliable place is a reporting problem before it is a strategy problem, and it is usually where better revenue forecasting starts.
Growth and profit are not opposites
The framing of “growth versus profit” is misleading. Fast growth can hide weak economics for years. High margins with no growth can leave you with an efficient business in a shrinking market. Neither extreme is safe.
The useful question is narrower: is each additional dollar of growth cheaper or more expensive than the last one? If new customers cost more each quarter and stay for less time, more sales activity makes the problem bigger, not smaller.
Set thresholds before you scale: the CAC payback you will accept, the minimum gross margin for a new product line, and the discount level that needs approval. Those guardrails let you push hard on growth without reopening the argument every quarter. Choosing scaling strategies in advance is far easier than reversing a bad one under pressure.
Design a go-to-market that earns its cost
Most margin is won or lost in how you sell, not in how you build. Go-to-market, usually shortened to GTM, simply means the combination of segments, channels and people you use to reach buyers.
Segment by value, not by logo
Rank customer groups by two things: what they pay and what they cost to serve. The result often surprises teams. A famous logo that demands custom work and a quarterly business review can be worth less than a quiet mid-market account on a standard plan.
Pricing follows from that ranking. Value-based pricing, where the price reflects the outcome the customer gets rather than your costs, is the usual way to raise margin without raising volume. A structured pricing strategy framework keeps the change from turning into ad hoc discounting.
Match the seller to the deal
Two mistakes cost the most money. Putting expensive, senior salespeople on small transactional accounts burns margin on deals that cannot repay it. Putting junior, low-touch reps on complex enterprise deals loses the expansion revenue that makes those accounts worthwhile.
Audit your coverage once a quarter: which accounts are served by whom, at what cost, and with what result.
Automate the bottom, advise the top
Self-serve signup and automated onboarding should carry the small end of the market, where a human conversation costs more than the contract is worth. Consultative selling belongs where the margin pays for it.
That split is the practical core of a product-led growth playbook. The comparison between product-led and sales-led growth is less a choice than a question of which motion serves which segment.
Build operations that scale margin, not headcount
When systems replace heroics, teams handle more work without adding cost. That is the whole argument for operational investment, and it is testable.
Start with the handoffs. Leads that go cold between marketing and sales, or accounts that surprise the support team at go-live, cost real money in rework. Aligning sales and marketing around one definition of a qualified lead removes a surprising amount of waste.
Then look at duplication. Many companies carry three or four overlapping operations roles across marketing, sales and finance. Consolidating them into one revenue operations function usually raises revenue per employee. Our guide to revenue operations efficiency covers how to structure it.
Enablement deserves a caution. Too little and your team cannot carry a larger book of accounts. Too much and you have built an internal department that sells nothing. Judge sales enablement by whether ramp time falls and win rates rise, not by how much content it produces.
Finally, automate the back office. Finance automation for invoicing, collections and approvals shortens the gap between doing the work and holding the cash, which is the part of profitability that spreadsheets tend to ignore.
A practical roadmap for the next quarter
Step 1: Audit the book
Export every account with its revenue, gross margin, acquisition cost and service cost. Sort by margin. Most teams find that a small share of accounts produces most of the profit, and that a long tail produces almost none while consuming support time.
Decide three things for the tail: raise the price, reduce the service level, or let it go. Doing nothing is also a decision, and it is usually the expensive one.
Step 2: Instrument the stack
Your CRM and finance system have to agree on what a customer is worth. Until they do, every margin discussion becomes an argument about the data.
Automate renewal alerts, discount approvals and price tests so the guardrails enforce themselves. Then agree on a short list of measures that leadership reviews monthly; RevOps productivity metrics are a reasonable starting set.
Step 3: Reinvest with intent
A profitability focus is not a permanent cost freeze. It is a rule about where money goes: toward offers with proven payback, markets where you have pricing power, and expansion into accounts that already renew.
Write a short memo for each significant bet, naming the expected payback period and what would prove it wrong. It keeps the conversation with your board honest and makes it easier to stop something that is not working.
Where the profitability push goes wrong
Cutting is easier to measure than building, which is exactly the danger. Marketing spend, product research and customer success are the easiest lines to reduce and the slowest to show damage. The margin improves this quarter; the pipeline empties two quarters later.
Three warning signs are worth watching. Deal sizes shrink because nobody is investing in the product. Churn rises quietly among accounts that lost their success manager. Pipeline thins while the team celebrates a better operating margin.
There is also a category error to avoid. Some companies genuinely should spend ahead of revenue, particularly where a market is being created rather than contested. Business model innovation often needs exactly that kind of patient money. The point is not that every company must be profitable next quarter. It is that every company should know what its growth costs and be able to defend the answer.
Conclusion
A profitability focus is a change in what you measure, not a change in ambition. Growth still matters. What has changed is that the market no longer treats growth as proof of anything on its own.
Start small. Pick the five numbers, get them accurate, and review them monthly with the same seriousness you give the revenue line. Run the account audit once and act on it. Set thresholds that stop bad deals before they are signed.
RevOps business trends can guide how you sequence these steps, and keeping an eye on customer loyalty makes sure efficiency does not come at the expense of the people paying your bills. Companies that build this habit tend to enter the next downturn leaner and leave it ready to invest again.
Found this useful?
Make SmartKeys a preferred source on Google, and our articles will surface more often in your Top Stories, AI Overviews, and AI Mode.
Add as Preferred Source