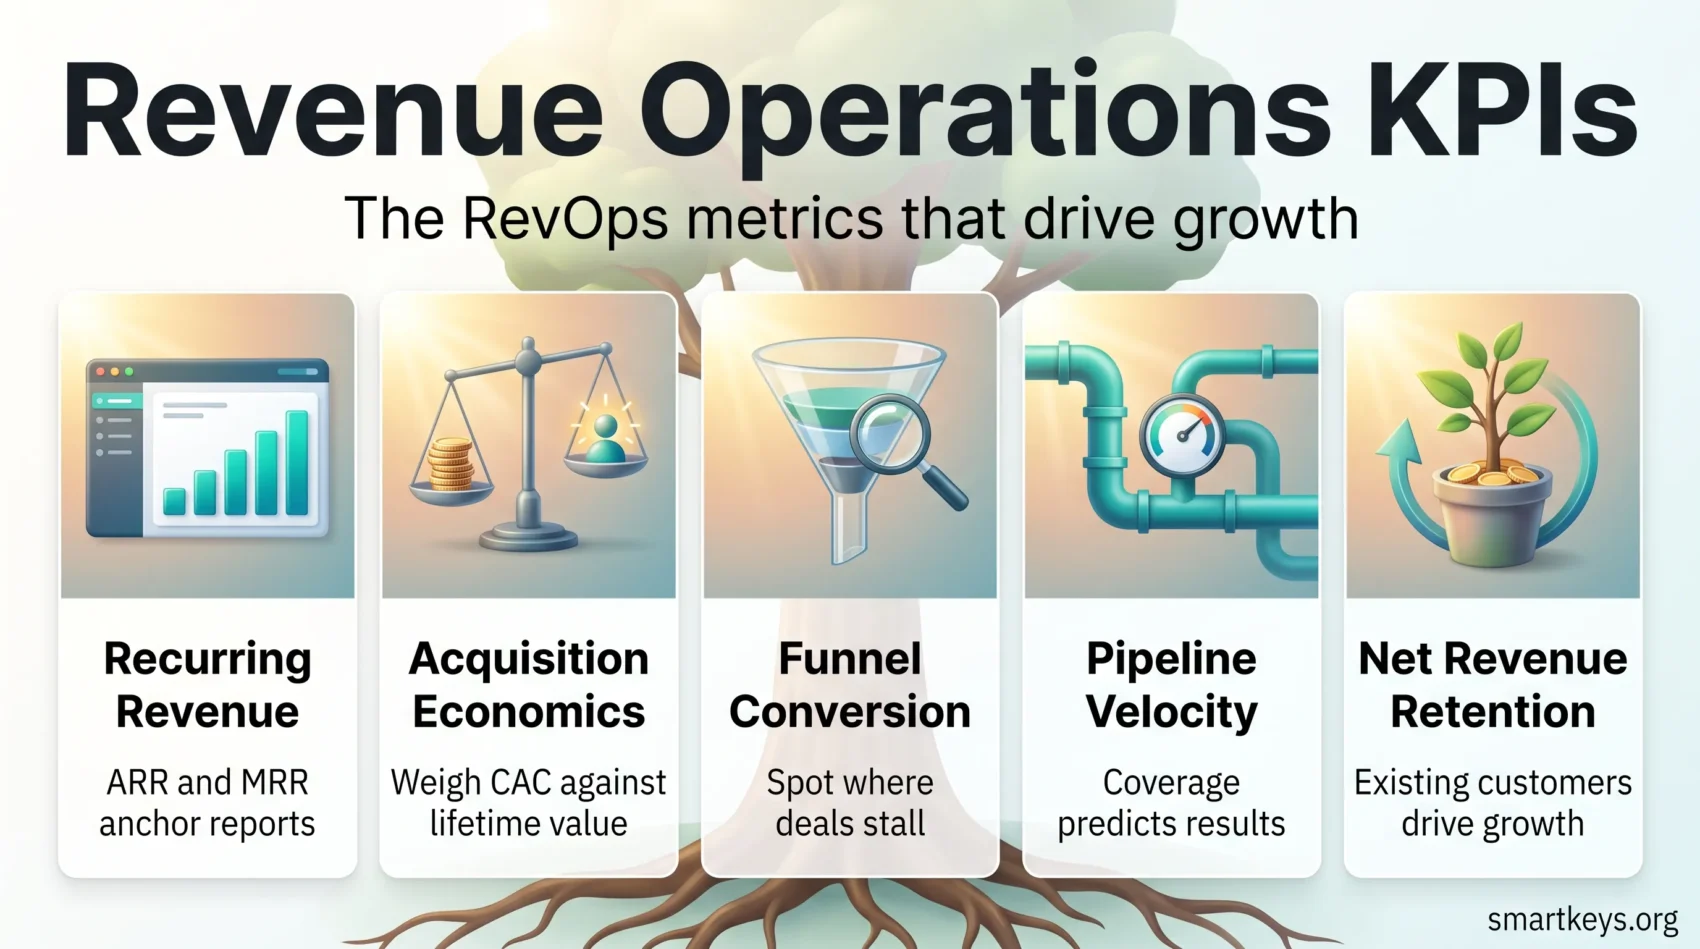
RevOps, short for revenue operations, is the practice of running sales, marketing, and customer success as one system with shared data and shared targets. This guide covers the revenue operations KPIs that system needs, how to calculate each one, and how to review them often enough to act.
Most teams do not suffer from too few numbers. They suffer from three teams quoting three different figures for the same quarter. Marketing counts a lead one way, sales counts it another, and finance reconciles both at the end of the month. By then the quarter is already decided.
The fix is boring and effective: agree on a short list of definitions, calculate them the same way everywhere, and look at them weekly. This article gives you plain definitions for ARR, MRR, CAC, LTV, NRR, conversion rates, and churn, plus the forward-looking pipeline measures that give you time to react.
Key Takeaways
- Align sales, marketing, and customer success around one shared revenue goal.
- Use clean data and simple formulas for ARR, MRR, CAC, and LTV.
- Watch forward-looking signals like pipeline coverage and sales velocity, not just closed revenue.
- Separate what marketing sourced from what marketing influenced, and agree the rules in advance.
- Track CSAT, NPS, and product adoption to catch churn risk before renewal season.
- Run one small dashboard per role and one short weekly review. Nothing more.
What revenue operations KPIs measure, and why it matters now
Revenue operations unites the three teams that touch a customer: marketing, which creates demand; sales, which closes it; and customer success, which keeps and expands it. Under a RevOps model, those teams share one definition of a lead, one pipeline, and one set of reports.
That matters because handoffs are where revenue quietly leaks. A lead sits in a queue for two days. A renewal date is missing from the CRM. An expansion opportunity is never flagged because nobody owns product usage data. None of these show up in a monthly revenue report until the money is already gone.
Measuring the system, rather than each team separately, is what surfaces those gaps. If you are building the function itself rather than just its reporting, our practical revenue operations playbook covers team structure, process and revenue leakage in more depth.
Company-wide KPIs versus department dashboards
Both layers are useful, and they answer different questions.
Department measures track activity: calls made, click-through rate on an ad campaign, average ticket response time. They tell a manager whether their team is working well this week.
Company-wide KPIs track outcomes across the whole customer lifecycle: recurring revenue, retention, the cost of winning a customer against the value that customer returns. They tell leadership whether the business is working.
Report the second kind upward. Use the first kind inside teams. Problems start when a department metric gets promoted to a board metric, because a team can hit its own number while the company misses its own.
What leadership actually asks for
Boards and investors keep coming back to recurring revenue, because it is the number that can be projected forward with any confidence. A one-off deal tells you about last month. A subscription base tells you something about next year.
Retention is the close second, and for good reason. If renewals and expansion slip, growth stalls even when new sales look healthy. That is why net revenue retention often predicts long-term growth better than new business alone.
The third question is efficiency: what does it cost to win a customer, and how long before that customer pays the cost back. Answer those three and most other questions become follow-ups.
Set goals first, then pick the metrics
Choosing metrics before agreeing the goal is how teams end up with conflicting incentives. Start with the business outcome. Say you want 20% more revenue next year. Break that into targets each function can actually influence.
A realistic split might be 10% more new business, 5% more expansion revenue from existing accounts, and 5 percentage points less churn. Now marketing, sales, and customer success each have a number they own, and all three add up to the same goal.
Turn outcomes into SMART targets
SMART is an old checklist that still does useful work: specific, measurable, achievable, relevant, and time-bound. “Improve conversion” fails it. “Raise demo-to-opportunity conversion from 22% to 27% by the end of Q3” passes.
Keep the core set small. Five to seven company-level numbers is usually enough. Include at least two leading signals, such as pipeline coverage and stage conversion, so you can correct course while the quarter is still open. If the two front-line teams still work to separate targets, our guide to aligning sales and marketing covers how to close that gap first.
Agree definitions across the three teams
This is the least glamorous step and the one that saves the most arguments. Write down what counts as a qualified lead, when an opportunity is created, what “closed won” requires, and how a renewal is recorded.
Give every metric one accountable owner. Decide who is allowed to change a definition and where that change gets logged. Then check that targets match capacity: a quota that needs 40% more pipeline than your team can generate is a forecast miss with extra steps. Once the definitions hold, the repetitive parts of enforcing them can be automated, which our overview of RevOps automation tools covers in detail.
“Governance sounds heavy. In practice it is one page: who owns each number, who can change it, and where the change is recorded.”
Leading and lagging indicators
Every metric is either a record of what happened or a hint about what will happen. Mixing the two without labelling them is what makes dashboards feel busy but useless.
Lagging indicators confirm results. ARR, MRR, closed revenue, win rate, and net revenue retention all belong here. They are what you report to a board, and they are accurate. They are also too late to act on.
Leading indicators point forward. Weighted pipeline value, pipeline coverage, sales velocity, and stage-by-stage conversion rates all move weeks before revenue does. Customer signals such as CSAT, NPS, and product adoption work the same way for retention.
Use leading indicators to trigger action and lagging indicators to check whether the action worked. Set a threshold for each leading signal so a decline creates an alert rather than a conversation three weeks later.
Revenue foundations: ARR, MRR, and growth rate
These three are where every RevOps report starts, because hiring plans, product bets, and marketing budgets are all sized against them.
ARR and MRR
Annual recurring revenue (ARR) is the total recurring revenue your contracts produce over twelve months. If 1,500 customers each pay $300 a year, ARR is $450,000.
Monthly recurring revenue (MRR) is the same idea at monthly resolution. If 500 subscribers each pay $20 a month, MRR is $10,000.
Only genuinely recurring revenue belongs in either figure. One-off setup fees, professional services, and hardware sales are real income, but including them inflates a number whose whole value is predictability.
Revenue growth rate
Growth rate is the change between two periods:
(revenue this period minus revenue last period) divided by revenue last period, times 100.
The headline number tells you the direction. The segments tell you the reason. Split growth by product line, by customer cohort, and by acquisition channel, and a flat quarter usually turns out to be one segment growing while another shrinks.
For context on what a normal number looks like, SaaS Capital’s 2026 survey of more than 1,000 private SaaS companies put median annual growth at 15% for bootstrapped firms in the $3M to $20M ARR range. Benchmarks vary widely by size and funding model, so treat any external figure as a rough reference rather than a target.
Acquisition economics: CAC, LTV, and the ratio between them
Two numbers decide whether growth is worth paying for: what a customer costs to win, and what that customer returns.
Customer acquisition cost
Customer acquisition cost (CAC) is total sales and marketing spend divided by the number of new customers won in the same period. Spend $200,000 and win 400 customers, and CAC is $500.
Include everything: advertising, events, agency fees, software, and the salaries of the sales development reps who book the meetings. Leave salaries out and every channel looks cheaper than it is, which is the most common way CAC gets quietly understated.
Customer lifetime value
Customer lifetime value (LTV, sometimes CLV) estimates the gross profit a customer produces before they leave. A simple version is annual revenue per customer, multiplied by expected years retained, minus the cost of serving them.
Four things move it: retention, expansion revenue, pricing, and how quickly a new customer reaches their first real result. That last one is underrated. Faster time to value shortens payback and lifts LTV without changing the price. Your pricing and your onboarding process both show up in this number.
The LTV:CAC ratio
Divide lifetime value by acquisition cost and you get a sanity check on unit economics. A widely used rule of thumb in SaaS is that 3:1 is healthy and 1:1 means you are buying revenue at a loss. It is a heuristic, not a law, and it depends heavily on your payback period and your cash position.
Read the ratio by channel, not just as a company average. A channel with double the CAC can still be your best one if it brings customers who stay twice as long. Segment first, then decide where the next marketing dollar goes.
“Measure both halves of the equation. What you pay to acquire, and what customers actually return over time.”
Funnel health and conversion rates
Conversion rates tell you where deals are lost, which is more useful than knowing how many were lost.
Lead conversion rate is conversions divided by total leads, times 100. Turn 80 of 1,000 leads into customers and the rate is 8%.
The overall figure is a headline. The stage-by-stage figures are the diagnosis. If lead to meeting holds steady but meeting to opportunity halves, the problem is qualification or discovery, not traffic. Buying more leads at that point makes the problem more expensive, not smaller.
- Measure conversion at every stage, not just end to end.
- Compare win rate against stage progression to separate coaching problems from process problems.
- Track conversion by channel and campaign, so budget follows what actually closes.
- Compare against your own historical baseline first. External benchmarks differ too much by deal size and market to be a target.
Small gains early in the funnel compound. Improving lead-to-meeting conversion by two points affects every stage after it, which is usually cheaper than trying to rescue late-stage deals.
Pipeline, forecasting, and sales velocity
Pipeline metrics answer the question leadership asks most often: are we going to make the number, and when will we know.
Weighted pipeline and coverage
Weighted pipeline value is the number of open deals multiplied by average contract value multiplied by win rate. It converts a long list of optimistic opportunities into a realistic dollar figure.
Pipeline coverage compares that value against quota. Many B2B teams aim for roughly three times quota in open pipeline, on the reasoning that most deals do not close. Your own historical win rate should set your number, not a figure borrowed from another company.
Sales velocity and cycle length
Sales velocity is pipeline value divided by average sales cycle length. The result is dollars per day, which makes it easy to see what slow deals cost you.
Cycle length is total days across all closed deals divided by the number of deals. Shortening the cycle raises velocity without hiring anyone, which is why it is usually the first lever worth pulling.
Making forecasts credible
Track the gap between what you forecast and what actually closed, every period. Forecast accuracy is itself a metric, and it improves once someone is accountable for it.
Combine the model with seller judgment rather than choosing between them. Weighted pipeline gives the baseline, and the rep who has spoken to the buyer knows things the CRM does not. Our guide to RevOps revenue forecasting models goes deeper on how to choose and build one, and the RevOps efficiency playbook shows how forecasting fits the wider function.
Sales productivity and efficiency
These measures show whether your team scales or just grows.
Quota attainment and average deal size
Quota attainment is the share of reps hitting their target. When most of the team misses, the cause is rarely effort. It is usually lead quality, an unrealistic quota, or a process step nobody can get through.
Average deal size trends tell you whether you are moving upmarket or drifting down. Rising deal size with a stable cycle length is the healthiest pattern there is.
Cycle length against deal size
Read these two together. Longer cycles are acceptable if deals are getting bigger. Longer cycles with flat deal size mean friction has crept into the process, and pipeline is ageing for no return.
Revenue per employee
Revenue per employee is total revenue divided by headcount. It is a blunt instrument, but it answers a sharp question: is the next hire adding leverage or just cost.
Use it to test hiring plans and territory design. If revenue per employee falls for three quarters while headcount rises, the process is the constraint, not capacity. Teams selling remotely have their own version of this problem, covered in our piece on remote and hybrid sales teams.
Marketing’s contribution: sourced, influenced, and cost per lead
The recurring argument between sales and marketing is about credit, and it is settled by agreeing attribution rules in advance.
Marketing-sourced revenue counts deals that started with a tracked marketing lead. It is the clean, defensible slice, and it is the number finance tends to trust.
Marketing-influenced revenue counts deals that marketing touched at any point: a webinar attended mid-cycle, a case study read before signature, a retargeting campaign during a stalled negotiation. Multi-touch attribution captures this, and it is always messier than sourced revenue. It is also where most brand and content investment shows up.
Report both. Sourced revenue alone undervalues everything that is not a form fill, and influenced revenue alone is too generous to be credible.
- Break out CAC and LTV by channel before shifting any budget.
- Calculate cost per lead and campaign return, but read them next to close rates. Cheap leads that never close are not cheap.
- Measure speed to first response. It is one of the few marketing and sales handoff metrics that reliably moves conversion.
- Include existing customers in campaign tracking, so expansion and renewal value is not invisible.
Modern CRM platforms handle most of this automatically, and our overview of digital marketing strategy covers how attribution has changed as tracking has become harder.
Retention: churn, NRR, CSAT, and NPS
Retention is where recurring revenue is either compounded or lost, and its warning signs appear long before a renewal date.
Churn and renewal rate
Churn rate is customers lost during a period divided by customers at the start, times 100. Renewal rate is the same picture from the other side.
Track both logo churn (how many customers left) and revenue churn (how much money left). They can diverge sharply. Losing ten small accounts and losing one large one produce very different numbers, and only revenue churn tells you which happened.
Net revenue retention
Net revenue retention (NRR) measures what happens to the revenue you already had, without counting new customers:
(starting revenue plus expansion minus churned and downgraded revenue) divided by starting revenue, times 100.
Above 100% means your existing base grows on its own. Below 100% means new sales are refilling a leaking bucket. In SaaS Capital’s 2026 benchmarking survey of more than 1,000 private SaaS companies, median NRR for bootstrapped firms was 103%, with the top decile near 118%. Figures well above that circulate in industry commentary, but they usually come from a narrow set of enterprise vendors rather than a typical company.
CSAT, NPS, and product adoption
CSAT is the share of survey respondents who say they are satisfied. NPS is the percentage of promoters minus the percentage of detractors, based on how likely customers are to recommend you.
Neither is a precise instrument, and both are easy to game. Their value is as trend lines. A steady drop in either, in a particular segment, is worth a call before the renewal conversation starts.
Product adoption is the harder signal and the more honest one. If a customer never reached the feature they bought you for, satisfaction scores will not save the renewal. Track time to first value and usage of the features tied to the buying decision. Our guide to customer retention strategies covers the plays that follow these signals.
Operations: data quality, tool adoption, and system health
Every metric above depends on the systems underneath it. Reporting is only as good as the data captured at the point of work, and that is an operations problem before it is an analytics one.
Data quality
Decide which fields your reporting genuinely needs, then enforce them at capture rather than cleaning them later. A required close date and a required source field will do more for forecast accuracy than any model.
Assign an owner for each core object: accounts, opportunities, contacts, renewals. Build a fast route for reporting a bad record. A formal data governance strategy is worth the effort once more than a handful of people write to the CRM.
Tool adoption and system health
Track active users and feature adoption for the tools you pay for. Low adoption usually means unclear workflows or a duplicate tool doing the same job, and both are fixable without buying anything.
Monitor uptime, sync errors, and integration failures too. A silent overnight sync failure creates a reporting gap that nobody notices until a board meeting. Log integration errors, fix them within an agreed time, and test the end-to-end flow after any change. Platforms like Workato and similar integration tools exist mainly to make these failures visible.
Make the numbers usable
Clean data is necessary but not sufficient. People also need to be able to read it. Investing in data literacy across the team is what turns a dashboard from a report into a decision.
Dashboards, cadence, and turning numbers into decisions
The last step is the one most often skipped. Metrics change nothing until they are attached to a meeting where someone decides something.
Role-based dashboards
Build a different view for each level, and keep each one small. Three to five cards per view is a good ceiling.
Executives need recurring revenue, forecast confidence, and retention. Managers need pipeline coverage, conversion by stage, and deal ageing. Reps need their own pipeline and their next actions. Every card should tie to a goal and name an owner, so it is obvious who acts when a number moves.
A weekly rhythm that holds
Run one short weekly review. Look at the leading indicators, name what changed, agree the next action, and record who owns it and by when.
Add a monthly or quarterly review for the lagging numbers and for the definitions themselves. Markets shift, and a metric set built for a growth push will need reweighting when the priority moves to retention. Close the loop by checking previous decisions against what actually happened, which is the only reliable way a team’s decision-making improves.
Conclusion
A RevOps metric set is not a reporting exercise. It is an operating system for three teams.
Start narrow. Take ARR or MRR and net revenue retention as your anchors. Add two or three leading signals, such as pipeline coverage and stage conversion, so you get early warning. Add CAC and LTV by channel once your data is clean enough to trust the split.
Then do the unglamorous part: write down the definitions, name an owner for each number, set thresholds that trigger action, and put one short review in the calendar every week. The teams that forecast well are rarely the ones with the most sophisticated model. They are the ones who agreed what a qualified lead is eighteen months ago and never changed it without telling anyone.
Found this useful?
Make SmartKeys a preferred source on Google, and our articles will surface more often in your Top Stories, AI Overviews, and AI Mode.
Add as Preferred Source