Your revenue engine is probably leaking money in the gaps between teams, not inside them. A lead sits unrouted for two days. A quote gets rebuilt by hand. A renewal nobody flagged until the last week of the contract. IDC research is often cited as putting the cost of this kind of inefficiency at 20 to 30% of annual revenue.
Revenue operations (RevOps) is how you close those gaps. RevOps is the practice of running marketing, sales, customer success, and the revenue side of finance as one system, with shared data, shared processes, and shared targets. In 2026 it is no longer a niche idea. One 2026 survey of more than 1,200 B2B companies found that 78% of firms with 50 or more employees now run a dedicated RevOps function. In 2023 the figure was 48%.
The payoff is well documented. Forrester research found that organizations with strong alignment across marketing, sales, and product report 2.4 times higher revenue growth and twice the growth in profitability of those without it.
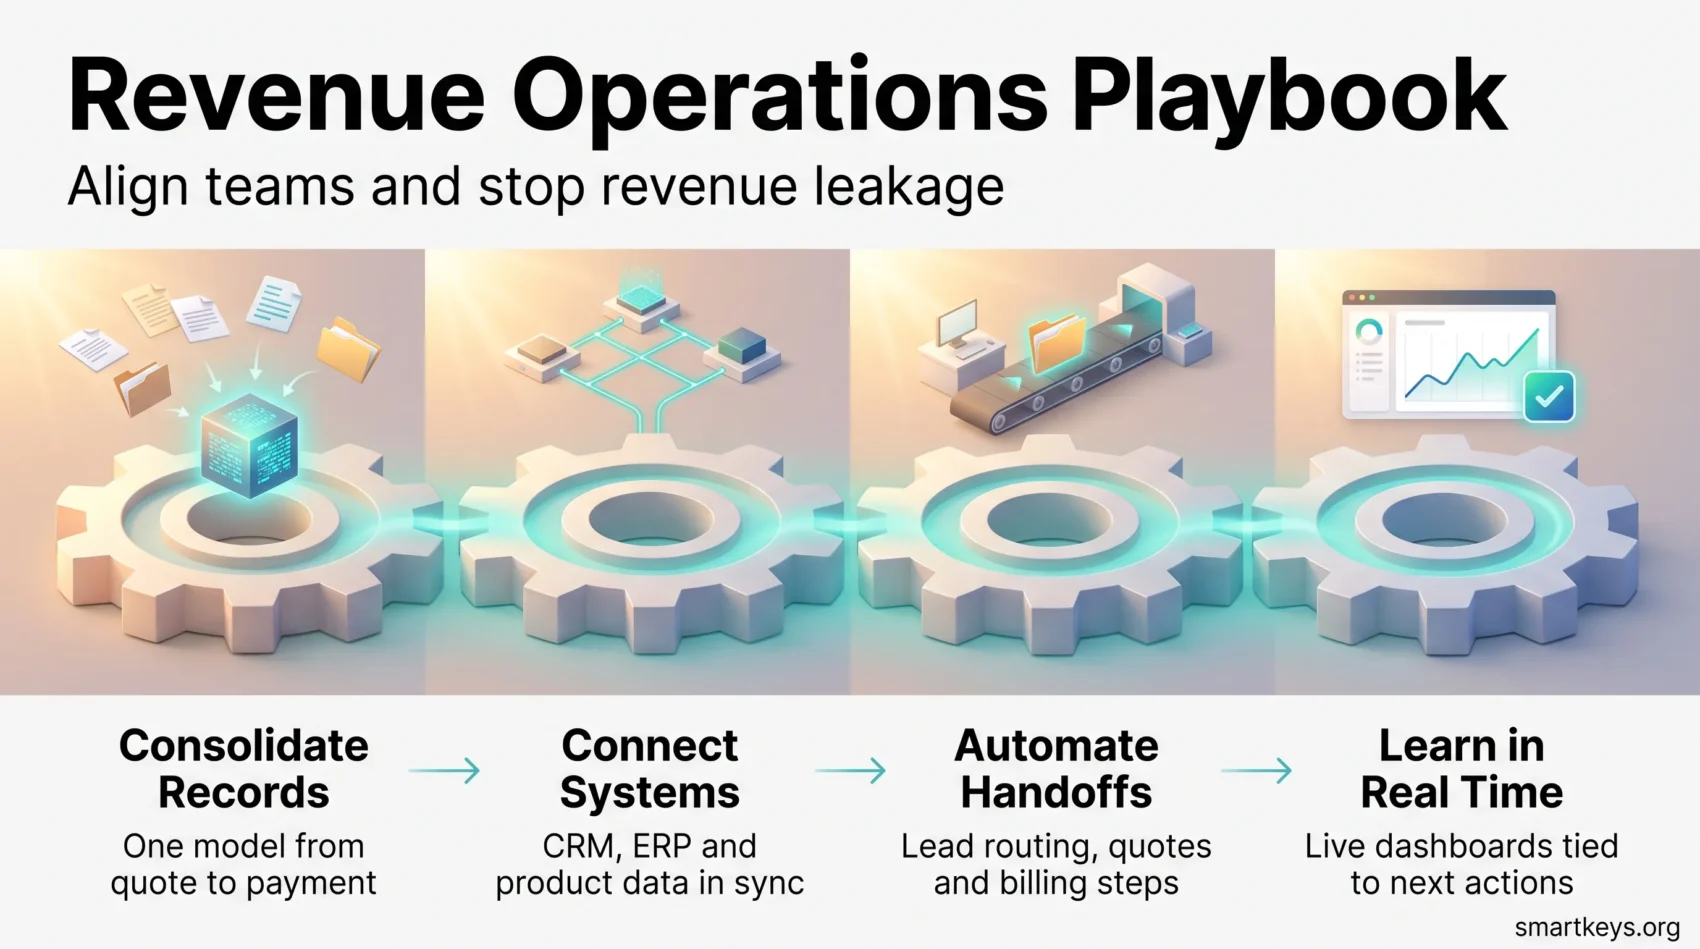
This playbook gives you the practical path. Map the customer journey from first touch to cash. Clean up and consolidate your revenue data, and connect your CRM and finance systems. Then automate the handoffs that break most often and run a 90-day plan that proves lift before you ask for more budget.
Key Takeaways
- Operational gaps, not weak selling, are where much of the lost revenue hides. That money is recoverable.
- RevOps is now mainstream: about 78% of B2B companies with 50+ employees have the function.
- The 2026 priority is subtraction, not addition: 67% of RevOps leaders say they plan to cut their tool count this year.
- AI helps most with research, enrichment, scoring, and forecasting today. Fully autonomous execution is still rare.
- Staff to a ratio, not a hunch: about 1 RevOps person per 25 to 30 revenue team members, or 1:15 to 20 for top performers.
- Shared goals, full-funnel visibility, and one trusted data source let teams decide faster and stay consistent.
What Revenue Operations Is and Why 2026 Raised the Stakes
Think of revenue operations as the single thread that ties marketing, sales, customer success, and finance into one growth engine. That thread removes duplicate work and gives every customer the same experience, whichever team they happen to be talking to.
From fragmented functions to a unified revenue engine
Without RevOps, each team optimizes its own numbers. Marketing counts leads, sales counts closed deals, customer success counts renewals, and finance counts cash. Each number can look healthy while the business as a whole underperforms. RevOps puts all four on the same data, the same definitions, and the same plan, so a decision in one team does not quietly create a problem in another.
A useful way to picture the function is as four building blocks. Process defines how work moves from stage to stage. Enablement makes sure people know how to follow that process. Advisory turns data into recommendations leaders can act on. Systems are the tools and integrations that hold it all together. If one block is missing, the other three wobble.
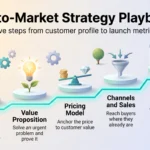
The market of 2026 makes this urgent rather than nice to have. Industry benchmarks show B2B sales cycles have grown longer since 2022 and win rates have slipped, while buyers do more of their research without talking to a seller. None of that is fixed by hiring more reps. It is fixed by removing friction from the motion you already run, the same logic behind a well-run go-to-market strategy.
RevOps vs. sales operations: scope, impact, and ownership
Sales operations improves the middle of the funnel: territories, quotas, pipeline hygiene, and sales tooling. Revenue operations covers the full journey, from product and pricing through billing and cash collection. Treat RevOps as its own function with its own mandate, not as sales ops with a new name. Otherwise it inherits sales ops’ narrow scope and never touches the handoffs where revenue actually leaks.
The practical result: fewer handoff errors, better forecasts, and clear ownership of the customer lifecycle. Executive sponsorship and a defined role for the operations lead keep the organization moving toward one plan.
- Unified metrics reduce rework and help you prioritize customer impact.
- Coordinated planning prevents conflicting priorities across teams.
- Clear ownership shows who leads and how teams partner on goals.
The Cost of Inefficiency: Where Revenue Actually Leaks
Siloed systems turn good work into wasted effort. The leak is rarely one dramatic failure. It is dozens of small ones that nobody owns, because each one sits between two teams.
How silos distort metrics and morale
Picture marketing celebrating a record month of MQLs (marketing qualified leads, the contacts marketing considers ready for sales) while sales misses its number. Both teams have a dashboard that says they are right. When dashboards conflict, people stop trusting any of them and fall back on gut feeling.
Data quality is the root cause more often than teams admit. Incomplete CRM records, duplicate accounts, and missing close dates feed straight into the forecast, and very few companies hit their forecasts consistently. You cannot forecast your way out of dirty data. That is why a deliberate data governance strategy is the unglamorous foundation of everything else here.
Tool sprawl makes it worse. Revenue teams often pay for dozens of separate tools and use only a fraction of the features in each. Partial adoption raises cost without lifting performance, a pattern we unpack in work tech overload.
What to watch for and how to act
- Early signs: rework, conflicting dashboards, and open disagreement about what a metric means.
- Fixes: create a single source of data, standardize handoffs, and align incentives across departments.
- Result: clearer forecasts, faster conversions, and better customer outcomes.
Start this quarter: map handoffs, cut redundant tools, and set shared KPIs (key performance indicators) so teams stop optimizing locally and the company recovers lost revenue.
When to Introduce RevOps: Start Early, Scale Smarter
Begin with the customer’s worst friction and design processes that solve it end to end. Doing this early keeps product and go-to-market aligned as you grow.
Step-zero thinking means working backward from real customer pain. For example, if new customers wait two weeks for their first invoice to be corrected, that is where you start, not with a new dashboard. Introduce RevOps late and you risk building a mess on top of a mess: patchwork integrations layered over processes nobody documented.
The trigger point is usually structural, not a headcount number. It is the moment one person can no longer see the whole funnel, or the first time a handoff between two teams costs you a deal you should have won.
How to get started
- Design around the customer’s top pain and map a minimal version of the journey.
- Set clear goals and operating rhythms that tie first touch to renewal.
- Assign ownership for core workflows so everyone knows who fixes what.
- Right-size tooling to avoid overlap and future tech debt.
Start early, keep the scope tight, and scale processes as growth milestones arrive. If you are still choosing between motions, our comparison of PLG vs. sales-led growth is a useful companion read.
RevOps Efficiency: The Core Principles You’ll Operate By
Set a practical operating model that turns data into faster, aligned decisions. Agree on a few guiding principles first so your teams move in the same direction.
Alignment on OKRs, targets, and a common language
Agree on OKRs (objectives and key results, a simple goal-setting format), definitions, and targets so teams speak the same language. A surprising number of conflicts come down to one word. If marketing calls someone a “lead” after a webinar sign-up and sales only after a booked demo, every report between them will argue. Write the definitions down and keep dashboards consistent with them. The mechanics of getting two historically separate functions to agree are covered in our framework for aligning sales and marketing.
Full-funnel visibility across the customer journey
Build a single view so marketing, sales, and post-sale work are visible end to end. Full-funnel visibility shows which levers actually move revenue and, more usefully, which ones you have been over-investing in.
Usability over visibility
A dashboard nobody opens is not visibility. The edge goes to teams whose managers and sellers can read the data in the moment and act on it, without filing a request with an analyst. Make insight the default, not a ticket.
Proactivity over firefighting
Use forecasting to move from last-minute fire drills to planning ahead, and build those insights into weekly meetings so decisions stay tied to reality.
- Metrics hierarchy: balance leading indicators, which warn you early, with lagging revenue results.
- Enablement loop: connect playbooks, training, and retrospectives to continuous improvement. See current sales enablement trends.
- Prioritization: focus on the few metrics that drive real performance and customer success.
Designing Your RevOps Team Structure for Your Stage
A stage-aware team model saves hiring mistakes and keeps the organization focused on measurable outcomes. Start by defining who owns outcomes, how data flows, and what success looks like this quarter.
Staff to a ratio, not a hunch
The same 2026 survey puts a healthy RevOps team at roughly one person per 25 to 30 revenue-facing employees across sales, marketing, and customer success. Top performers invest more, at 1:15 to 20. A company with 120 people in revenue roles would therefore plan for about four to five RevOps staff. Teams stretched much thinner than that tend to see CRM data quality slip first, and forecasts soon after.
Leadership and executive sponsorship
Begin with a clear lead who sets measurable KPIs and reporting lines. Secure executive sponsorship so the team has the budget and authority to change workflows across departments. Without it, RevOps turns into a reporting desk that describes problems but cannot fix them.
Analytics pods and focused insights
Build small analytics pods aligned to marketing, sales, and customer domains. These pods deliver domain metrics, quick experiments, and the insights leaders need to act. Pair them with the right business intelligence tools so reporting does not depend on one person’s spreadsheet.
Operations management and enablement
Assign operations managers to own processes, tool administration, and training. Strong enablement turns policy into daily habit and improves adoption across departments.
SMB vs. enterprise: practical org patterns
- Small businesses: start lean with a cross-functional manager or a consultant before hiring a dedicated RevOps team.
- Mid-market: form domain pods for analytics, operations, and enablement.
- Enterprises: centralize under a chief revenue officer (CRO) with specialized analysts and full-time operations roles.
- Engagement: set intake rules and response times so departments know how requests get prioritized.
Measure success by adoption rates, how reliably handoff deadlines are met, and clear business impact. Define role skills and growth paths so you keep good people.
Aligning Sales, Marketing, and Customer Success Around One Revenue Plan
Aligning your go-to-market functions around one plan removes friction at handoffs and makes targets simple to track.
Sales operations builds repeatable processes, keeps CRM data clean, and runs enablement and territory planning. Clean CRM data fixes forecasting gaps and lets sales teams operate predictably. The direction of travel is clear in the evolution of CRM.
Marketing operations owns the lead lifecycle, measurement, and attribution (working out which campaigns actually produced revenue). When marketing focuses on campaigns that move pipeline rather than lead volume, you get better conversion and clearer ROI. For high-value segments, pair this with an account-based strategy.
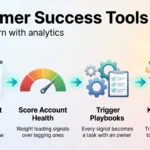
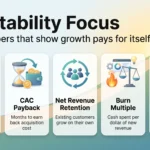
Customer success operations drives retention, expansion, and a consistent experience. Net revenue retention (NRR), the share of last year’s revenue you keep and grow from existing customers, has become a board-level number. Above 100% means your customer base grows even without new logos. Health scores and expansion plays protect that number, and our guides to customer success tools and customer retention strategies go deeper.
Finance collaboration ties billing and revenue integrity together. Connected billing and contract systems give you faster collections and clearer cash flow, and modern finance automation removes most of the manual reconciliation.
- Agree on shared definitions, such as what counts as a sales-accepted lead, each opportunity stage, and a healthy account, to improve conversion and forecasting.
- Tighten meeting rhythms so teams resolve issues fast and avoid finger-pointing.
- Align incentives and dashboards so data stays clean as it moves from marketing to sales to post-sale.
The outcome: unified teams that reduce friction, protect revenue, and deliver a consistent customer experience no matter which group is leading the moment.
Process Mapping: Visualizing the End-to-End Revenue Journey
Map every customer touchpoint so you can see where work stalls and why. Start with a simple visual that traces activity from first contact through cash collection. Keep it focused enough that your teams can use it this week, not next quarter.
Finding overlaps, gaps, and bottlenecks
Mapping sales, marketing, and customer success processes reveals overlaps that waste effort and gaps that cause rework. Document each step, its owner, what goes in, and what comes out, so the customer journey is consistent and measurable.
“When you can point to an exact handoff that fails, you can fix it.”
- Visualize flow: see how work moves from first touch through cash and where teams get stuck.
- Standardize stages: set entry and exit criteria so reporting and forecasting stay accurate.
- Define service levels: give every handoff an owner and a deadline, for example “inbound demo requests are contacted within one business hour”.
- Time each stage: measuring how long deals sit in each stage turns vague complaints into a ranked bottleneck list.
Automated data-sharing to reduce handoff friction
Automated data sharing removes manual handoffs and gives everyone the same context at the moment of transfer: what the buyer wants, what has happened so far, and what should happen next. Align processes to customer milestones so internal actions match the value the customer sees. The same discipline applied outside the revenue team is covered in our operations team efficiency playbook.
Data as Your Single Source of Truth
Treat your data layer as the backbone that keeps forecasts honest and teams aligned. When records live in one trusted place, you remove guesswork and speed up decisions.
Who owns the truth: CRM, finance, or customer success?
Teams often call the CRM the “truth”, yet finance and customer success hold critical records too. Decide explicitly where the source of truth lives for each type of data and how those systems reconcile, so reports match reality instead of arguing with each other. Many teams now collect behavioral and account data in a customer data platform and keep the CRM as the system of record for deals.
Data governance to standardize metrics across departments
Set a governance plan so metrics and definitions stay consistent across departments.
- Add data quality checks and assign an owner to each key field to reduce conflicting dashboards.
- Harmonize account, product, and revenue metrics so trends are easier to spot and act on.
- Document where each number comes from and who may change it, so decisions stay reliable and any AI tools have trustworthy data to work with.
Result: shared lifecycle metrics mean customer-facing teams stop chasing separate targets that undermine revenue.
The 2026 RevOps Tech Stack: Consolidate Before You Add
The biggest RevOps priority this year is subtraction. In the same 2026 survey, 67% of RevOps leaders said they plan to reduce their tool count. The “more is better” era of go-to-market tooling is over.
What gets cut first
The usual candidates: standalone data enrichment tools replaced by platforms that query several data sources in sequence, older sales engagement tools absorbed into all-in-one suites, and one-off dashboards replaced by CRM-native reporting or a proper BI layer. Audit by the job each tool does, not by logo.
Choosing tools to fix top inefficiencies
Start by listing your biggest pain points, then choose tools that close those specific gaps. Set adoption targets during procurement so you actually use what you buy. If you are building a shortlist, our comparison of the best RevOps automation tools for 2026, with pricing and selection criteria, is a good place to start.
Integrations that connect CRM, ERP, and customer data in real time
Connect your CRM, your ERP (the finance and operations system that handles orders, invoices, and accounting), and your customer platforms using shared data models. Real-time data flows prevent duplicate work and keep reports aligned across teams. Every territory change that needs a two-week engineering project is a governance failure, not a technology limit.
Automating repetitive tasks to unlock strategic work
Automate quoting, order-to-bill steps, enrichment, and routine handoffs so your team can focus on higher-value work. Low-code automation reduces errors and shortens the time from signed deal to cash in the bank. See where the wider market is heading in business automation trends.
Security, compliance, and total cost of ownership
Evaluate total cost of ownership, admin effort, and adoption, not just the license price. The hours your ops team spends maintaining integrations and chasing data discrepancies often cost more than the license itself. Build security and compliance checks into procurement and pick integrations that scale.
AI in RevOps: What Actually Works in 2026
AI use in RevOps has grown fast: the same 2026 survey found 61% of RevOps teams using AI in at least one workflow, up from 34% in 2025. But adoption is lopsided, and the gap is instructive.
Most teams use AI for narrow, well-defined jobs: researching accounts, enriching contact data, scoring leads, flagging deals that are likely to slip, and summarizing sales calls. Very few run AI agents that carry out multi-step work on their own in production. That gap tells you where the technology really is, as opposed to where the marketing is.
The honest read: AI works well as a helper that handles volume, such as scoring thousands of leads overnight or spotting patterns in buyer behavior. It is not yet reliable for running complex revenue processes end to end without a person checking the output. Gartner expects AI agents to outnumber sellers ten to one by 2028, yet predicts that fewer than 40% of sellers will say those agents improved their productivity. More automation does not automatically mean better results.
Build now for what comes next: clean data, documented processes, and clear escalation paths give AI something safe to act on later. Forecasting is where these foundations pay off first, and our guide to RevOps revenue forecasting models explains how time-series, pipeline, and predictive approaches compare. For the wider modeling picture, see predictive analytics for business growth.
- Start here: forecast scoring, enrichment, deal-risk flags, and call summaries.
- Wait on: autonomous multi-step execution across billing or contracting.
- Non-negotiable: a human review step wherever an AI output touches a customer or an invoice.
Metrics That Matter: Measuring Revenue, Efficiency, and Experience
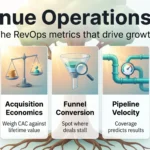
Measure the few signals that connect pipeline health to cash and customer outcomes. A tight scorecard helps you act before small problems become big ones. The four groups below give you the overview. For the exact formulas and worked examples, see our reference on revenue operations KPIs and how to calculate them.
Pipeline and revenue
Track annual recurring revenue (ARR), total contract value, win rates, and average revenue per account so you can see which deals move the needle. Benchmark honestly: B2B win rates have drifted down in recent years, so a flat win rate may actually be a relative gain.
Efficiency and cash
Monitor days sales outstanding (DSO, how long customers take to pay), revenue backlog, and cycle times to spot cash delays and process bottlenecks quickly. With sales cycles longer than they were a few years ago, time in each stage is one of the most useful numbers you own.
Retention and growth
Churn, renewal rate, NRR, customer lifetime value, and product adoption are your signals for customer health. NRR above 100% means your installed base grows without new logos.
Funnel health and strategic reviews
Measure how many marketing qualified leads become sales qualified leads, and watch qualification trends to guide enablement and fixes. Run regular pricing, competitor, and funnel reviews so your pricing strategy framework keeps pace with the market.
“Tie leading indicators to goals so forecasting becomes proactive, not reactive.”
Common RevOps Mistakes and How to Avoid Them
Most RevOps programs that stall do not fail on strategy. They fail on a handful of predictable mistakes in the first year.
No shared definitions. If “lead”, “opportunity”, and “churned customer” mean different things in different teams, every report becomes a debate. Fix the vocabulary before you build dashboards.
Automating too much, too early. Full automation looks tempting, but automating a process nobody has documented just produces errors faster. Start with one simple, high-volume step, such as alerting a rep the moment a lead meets your qualification criteria, and expand once it works.
Collecting the wrong data at the start. Web forms often ask questions that do not help sales qualify anyone, while leaving out the one field that would. Design forms and intake steps around the decisions the next team actually has to make.
Too many tools, not enough integration. Every extra tool adds another place where data can drift. A central platform, usually the CRM, with fewer and better-connected tools beats a large stack nobody fully uses.
No executive backing. RevOps changes how several departments work, and that needs someone senior to back it. Win that support by showing a concrete result early, for example fewer days from signed contract to first invoice.
Missing skills in-house. Few companies have people who understand both revenue processes and the systems behind them. A part-time consultant or a short external engagement can fill the gap while you build internal skills.
Your 90-Day RevOps Implementation Plan
Focus first on the data paths that touch a deal from quote to payment. Small wins build trust and clear the path for bigger changes.
Days 1 to 30: Consolidate revenue records
Bring product, account, quote, order, contract, invoice, and payment data into one model. Centralized records mean fewer disputes and faster closing. Run a tool audit in parallel and mark every overlap.
Days 31 to 60: Connect the systems from product to cash
Connect your product catalog, forecasting, CRM, and ERP so finance, sales, marketing, and customer success see the same view. Shared access is what turns a data project into an operations improvement.
Days 61 to 75: Automate key handoffs
Automate lead-to-opportunity routing, quote generation, and order-to-bill steps. Automation removes error-prone work and frees your team for high-impact tasks. Measure hours saved and error rates before and after. That difference is your business case.
Days 76 to 90: Learn from revenue in real time
Use live analytics to spot trends early, predict needs, and time cross-sell and upsell offers. Dashboards should tie directly to actions: who does what next, and by when.
“Make the data actionable and your team will act faster.”
- Centralize revenue-critical data so everyone uses the same accurate records.
- Set up a small governance group to keep integrations stable as you scale.
- Plan how you will introduce the changes to each team, then publish the 90-day results. Measured lift is how you fund the next phase.
Conclusion
Close the loop between data, tools, and people so your company scales without chaos.
Revenue operations turns fragmented work into one revenue engine that is easier to run and easier to scale. The 2026 picture is consistent: aligned organizations grow faster and more profitably, and the teams pulling ahead are consolidating their stack rather than expanding it.
Use the playbook: consolidate records, connect systems, automate the handoffs that break most often, and run a 90-day plan to prove lift. Align sales, marketing, and customer success so the customer experience stays consistent from first touch to renewal.
Measure the lift, adjust quickly, and keep decisions tied to clear metrics so growth compounds instead of stalling.
Found this useful?
Make SmartKeys a preferred source on Google, and our articles will surface more often in your Top Stories, AI Overviews, and AI Mode.
Add as Preferred Source