A revenue forecast is only as good as the model behind it and the data feeding that model. RevOps revenue forecasting models are the methods a revenue team uses to turn pipeline, history and customer signals into a number leadership can plan around. Get the model wrong and hiring, budgets and board commitments all inherit the error.
This guide focuses on that one job. It explains which forecasting models exist, when each one fits, how to prepare the data they depend on, where AI helps and where it still needs a person in the loop, and how to measure whether your forecast is actually getting better. The emphasis is on method rather than vendor hype: tools change every year, but the discipline underneath them does not.
Key Takeaways
- No single forecasting model suits every business. Deal size, cycle length and data history decide which one fits.
- Most mature teams run a hybrid: a statistical baseline, adjusted by a learned model, then reviewed by sales leadership.
- Forecast accuracy depends on CRM hygiene and clear stage definitions far more than on model sophistication.
- AI is strongest at pattern detection and deal scoring. The commit call still needs human judgement.
- Measure the forecast itself (accuracy, slippage, pacing), not just the revenue it predicts.
Why Revenue Forecasts Go Wrong
Revenue operations, or RevOps, runs marketing, sales and customer success on one shared set of data, targets and processes. If you want the full picture of how that function is set up, our guide to running revenue operations efficiently covers team structure, process and revenue leakage. This article stays with the forecast.
A forecast is a resource decision in disguise. It sets hiring plans, marketing budgets and what leadership tells the board. Wrong in one direction, you under-invest and miss demand. Wrong in the other, you over-hire and spend two quarters correcting.
Three failure modes cause most bad forecasts:
- Spreadsheet drift: manually maintained sheets fall out of sync with the CRM within days, and nobody knows which version is current.
- Undefined stages: if two reps read “proposal sent” differently, no model can fix the noise that creates.
- Optimism bias: purely qualitative rollups inherit whatever mood the sales floor is in that week.
Statistical and machine learning models help by exposing patterns in clean data. They do not repair dirty data. That is why forecasting maturity tends to follow overall analytics maturity rather than the size of the tooling budget. Shared definitions matter just as much: aligning sales and marketing around one revenue definition removes the arguments that make forecasts unusable.

The pay-off from getting this right is not one perfect number. It is a narrower range, a shorter gap between “something changed” and “we noticed”, and a forecast the finance team is willing to plan on.
The Data Layer Every Forecasting Model Depends On
Before choosing a model, check what it will learn from. Forecasting data rests on three layers, and a gap in any one of them flows straight into the number.
Integration: One View of Each Customer
Integration joins CRM records, marketing automation, product usage and support data, so the same customer is recognised everywhere. It removes the manual exports that introduce most errors. Many teams route this through a customer data platform, so matching records to the right customer happens once instead of in every downstream tool.
Hygiene: Records a Model Can Trust
Hygiene means removing duplicates, validating fields, defining stages and naming an owner for each record. It is the least popular part of RevOps and the one with the biggest effect. A forecast built on deals whose close dates get pushed without comment will be wrong whatever model reads them. A written data governance strategy keeps hygiene from decaying once the clean-up project ends.
Analytics: Turning Clean Data into Decisions
The analytics layer turns cleaned, joined data into something a revenue leader can act on. Increasingly that means self-service analytics, so a sales manager can check pipeline coverage without filing a ticket. Augmented analytics, where software flags anomalies automatically, surfaces changes nobody thought to look for.

Integration Is Not Migration
Treating the two as the same thing is a common and expensive mistake. A migration moves records once. An integration keeps two systems in agreement indefinitely, so it needs an owner, monitoring and a rollback plan. A workable sequence:
- Map the revenue process first. Document stages, triggers and handoffs before touching a connector.
- Name the source of truth for every shared object: account, contact, opportunity and subscription.
- Build, then reconcile. Compare record counts and totals across systems until they match. Unexplained gaps are future forecast errors.
- Hand over deliberately. Training and documentation stop the integration decaying after the project team moves on.
Once this foundation holds, real-time data becomes useful rather than merely fast. An alert only helps if the record behind it is trustworthy.
RevOps Revenue Forecasting Models Compared
The right model depends on three things: how big your deals are, how long your sales cycle runs and how much clean history you have. Here are the four families most revenue teams choose from.
Time-Series Models
Time-series models project the future from past patterns, such as last year’s monthly bookings plus seasonality. They work well for short horizons in businesses with steady rhythms, for example subscription renewals or high-volume transactional sales. They struggle when the sales motion changes underneath them, say after a price change or a move upmarket.
Causal and Regression Models
Regression models link revenue to drivers you can observe, such as marketing spend, headcount or the number of qualified meetings. Because they explain why the number moves, they are easier to defend in a board meeting. The catch: you need to have found the right drivers. A model built on the wrong ones looks precise and is simply wrong.
Machine Learning Models
Machine learning models handle many variables at once and pick up relationships that are not straight lines. They adapt as new data arrives. The trade-off is interpretability: a model that cannot explain why it lowered the forecast is hard to act on, and sales leaders tend to ignore numbers they cannot question.
Hybrid Models
Most mature teams run a hybrid. A statistical baseline sets the starting point, a learned model adjusts it for current deal signals, and sales leadership sanity-checks the result. Blending model output with the judgement of the people closest to the deals is not a weakness in the method. It is the method.
Top-Down and Bottom-Up in Parallel
Whichever family you pick, run two views side by side. The top-down view starts from market size and historical trend. The bottom-up view adds up individual opportunities. Where the two diverge is where the useful question lives: either the pipeline is thinner than the trend suggests, or the trend no longer reflects the market.
Techniques That Sharpen the Model
Two techniques feed most of these models in practice: predictive deal scoring and disciplined pipeline forecasting. They answer different questions and work best together.
Predictive Scoring: What Is Likely to Close
Predictive analytics uses past outcomes to estimate how likely a deal, account or customer group is to behave a certain way. Applied to the pipeline, it replaces flat stage probabilities (“every deal in proposal stage is 40%”) with scores based on deal size, how many buyers are engaged, how recent the last contact was and how similar deals ended. The score’s real value is the conversation it starts: a deal the model rates far below the rep’s confidence deserves a five-minute review. For the wider picture, see how predictive analytics is changing business decisions.
Pipeline Forecasting: Using History Well
Pipeline forecasting projects bookings from past performance, seasonality and current open deals. The common mistake is treating it as simple arithmetic. A weighted rollup only works if stage probabilities are recalibrated against real outcomes and slipped deals are tracked rather than quietly moved into next quarter. Comparing the reps’ own forecast against the model, and investigating the gap, usually tells you more than either number alone.

Where AI Improves Revenue Forecasting
AI’s contribution to forecasting in 2026 is more specific than the marketing suggests. It is good at three things. It reads unstructured signals, such as call transcripts, email threads and support tickets, that never make it into a CRM field. It notices that a pattern has shifted before the totals move. And it keeps scores current as new data arrives, instead of once a quarter.
It is still weak at the events that decide a quarter: a competitor cuts prices, a legal review stalls, a champion leaves. Those arrive as context, not as training data. The arrangement most teams settle on is AI for the analysis and the alerts, people for the commit call.

Lead and account scoring is the most mature application, and it feeds the forecast directly: better prioritisation at the top of the funnel produces a pipeline whose mix is easier to predict. Enrichment platforms help here, and our Clay AI review shows how prospecting workflows now assemble that data automatically. On the retention side, models that watch product usage and support activity flag churn risk while there is still time to act. That matters because renewal revenue is often the least well-forecast part of the plan, and customer success tooling is where those signals usually live.
The pattern matches AI adoption in business operations more broadly: the gains come from removing manual data handling, not from replacing judgement.
Where Forecasting Tools Fit In
Tools support the model; they do not replace it. Revenue intelligence platforms flag deals whose activity does not match a healthy pattern, business intelligence software is where the forecast is assembled and shared, and automation keeps records in sync. If you are comparing vendors, our roundup of the best RevOps automation tools covers the platforms, pricing and selection criteria. Whatever you choose, insist on governed metric definitions, so “pipeline coverage” means the same thing in every dashboard, and present the result clearly: data storytelling turns a forecast review into a decision rather than a chart-reading session.
How to Measure Forecast Accuracy
A forecasting model improves only when you measure the forecast, not just the revenue. Four measures do most of the work:
- Forecast accuracy: predicted versus actual, tracked per period and per team.
- Slippage rate: the share of committed deals that move into the next period.
- Stage conversion rates: recalibrated regularly against real outcomes, not set once and forgotten.
- In-quarter pacing: whether the quarter is tracking to its usual historical shape.
Most teams skip these, and without them there is no feedback loop. A forecast can be wrong in the same direction every quarter without anyone noticing. The business KPIs that feed the model, such as pipeline coverage, win rate, CAC and net revenue retention, are covered with formulas in our guide to revenue operations KPIs. The current direction of CRM platforms is toward exactly this kind of built-in revenue reporting.
Review on a fixed cadence: weekly for pipeline hygiene, monthly for trend and quarterly for recalibrating the model. Tie each review to a decision that already exists (the QBR, the board pack, the hiring plan) rather than creating new meetings.
Conclusion
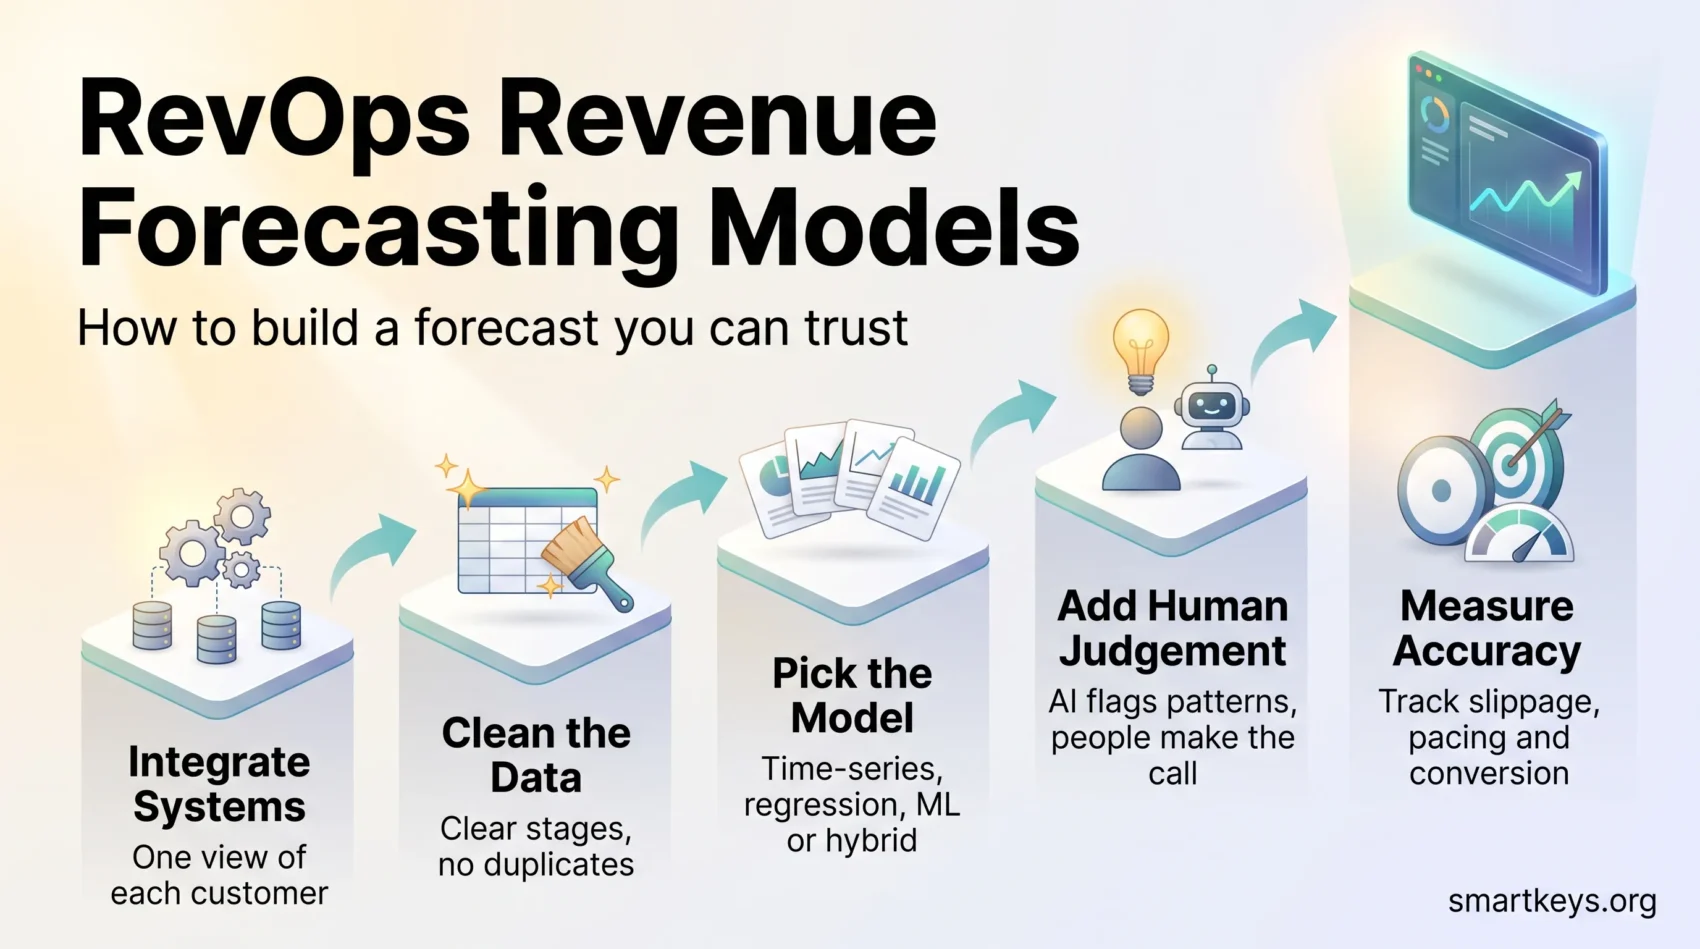
Choosing a forecasting model matters less than most vendor conversations imply. What decides accuracy is the order of work: integrate the systems, define the terms, clean the records, then pick the model that fits your deal size, cycle length and history. For most teams that ends up as a hybrid, checked against a parallel top-down view.
Measure the forecast itself so the process can learn, use AI for the pattern detection it does well, and keep human judgement for the context it cannot see. Teams that work in this order end up with a forecast their finance function trusts, which is the only test that matters. It also underpins the wider go-to-market planning that depends on knowing what next quarter actually looks like.
Found this useful?
Make SmartKeys a preferred source on Google, and our articles will surface more often in your Top Stories, AI Overviews, and AI Mode.
Add as Preferred Source