Predictive analytics turns historical data into an estimate of what happens next: which customers are about to leave, which machine is likely to fail, how much stock a warehouse needs in March. The techniques themselves are no longer exotic. What separates the companies getting value from them in 2026 from the ones stuck at pilot stage is almost never the choice of algorithm. It is the state of the data underneath.
Gartner research published in April 2026, based on a survey of 353 data, analytics and AI leaders, found that organisations with successful AI initiatives invest up to four times more of their revenue in foundational data capabilities than those with poor AI outcomes, while only 39% of technology leaders were confident their current AI investments would improve financial performance. Predictive analytics sits squarely inside that gap.
Key Takeaways
- Predictive analytics combines historical and real-time data to estimate future outcomes, with useful forecast horizons ranging from seconds to years.
- Grand View Research values the global predictive analytics market at $18.9 billion in 2024 and projects $82.3 billion by 2030, a compound annual growth rate of 28.3%.
- Data quality and governance, not model sophistication, are the usual reason predictive projects underdeliver.
- Gartner reports that organisations with the most mature AI-ready data capabilities achieve up to 65% greater business outcomes in revenue growth and cost optimisation.
- Retail, financial services, healthcare and industrial maintenance have the clearest and most repeatable use cases.
Introduction to Predictive Analytics
Predictive analytics uses historical data analysis to estimate future outcomes, and it is the working core of most modern business analytics programmes. A dashboard tells you what happened; a predictive model gives you a probability about what happens next, something you can act on before the event.
The commercial appetite is real: Grand View Research projects the global market to grow from $18.9 billion in 2024 to $82.3 billion by 2030. That reflects how far the tooling has come: models that once needed a dedicated data science team now ship inside augmented analytics platforms that surface forecasts to business users directly.
The everyday applications are unglamorous and valuable. Demand and supply chain forecasting sets inventory levels. Churn models decide which accounts get a call this week. Credit and fraud models decide which transactions get a second look. The model does not make the decision; it narrows what a person has to look at.
Proactive risk management is the other half of the picture. Spotting a supplier at risk of failing or a component about to break buys time to act. That is why predictive work belongs close to real-time data pipelines: a forecast delivered a week late is a report, not a decision aid.

Understanding Predictive Analytics Technology
Predictive analytics combines statistical modelling, machine learning and, increasingly, AI tooling to find structure in data. The mechanics matter even if you never build a model, because they tell you what a forecast can and cannot be trusted to do.
Definition and Core Concepts
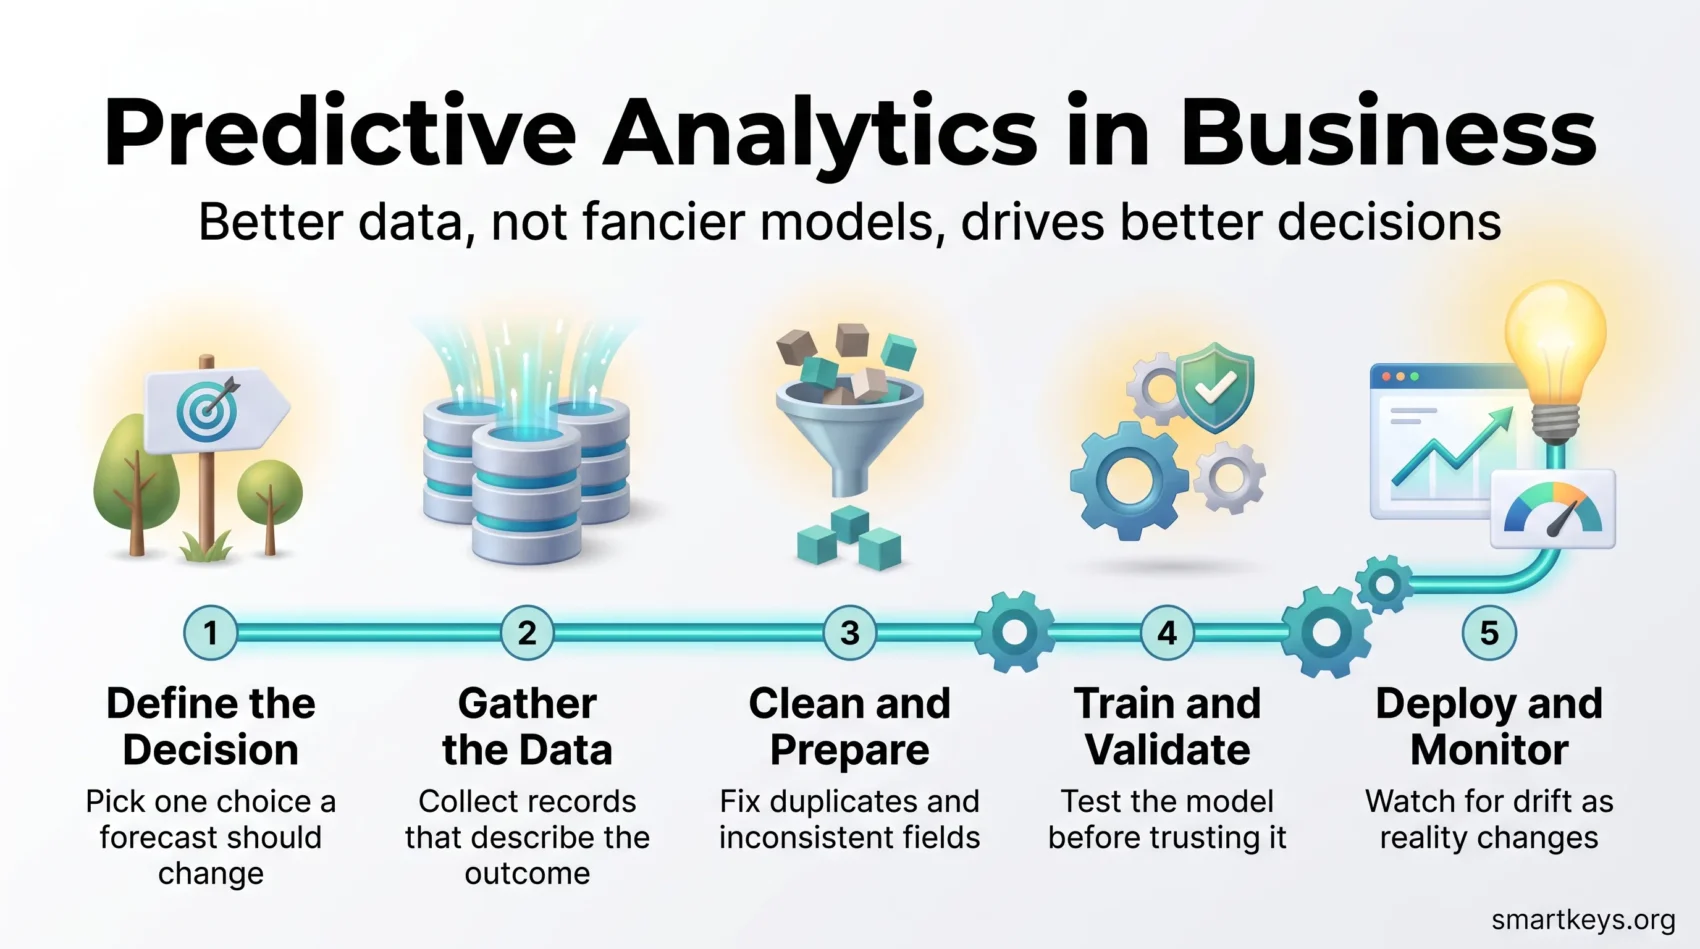
A predictive model learns patterns from labelled historical examples and applies them to new records. Regression, decision trees and neural networks are the workhorses. Whatever the technique, the workflow is the same five steps:
- Define the decision the forecast is meant to support
- Acquire and organise the data
- Clean and pre-process it
- Train and validate the model
- Deploy it, then monitor it as reality drifts
Step five is the one most often skipped. Models degrade as customer behaviour, pricing and competitors change, so a model without monitoring quietly becomes a model that is wrong.
How Algorithms and AI Enhance Predictions
Algorithms do the pattern-finding work across datasets far larger than anyone could inspect manually. Techniques you will meet repeatedly include:
- Gradient boosting
- K-nearest neighbour
- Support vector machines
- Bayesian analysis
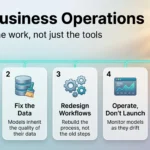
The newer layer sits on top. Gartner’s June 2026 trends report expects data streaming adoption for agentic AI to exceed 60% by 2028, up from under 15% in 2025. Predictions increasingly feed automated actions rather than a human reading a chart. That raises the stakes on governance, which is why the same report predicts explicitly modelled business decisions will be five times more trusted and 80% faster than ungoverned ones by 2029. Our guide to AI in business operations covers where that automation is actually paying off.

The Role of Data in Predictive Analytics
Data is the constraint. A well-chosen model trained on incomplete, stale or inconsistent records will produce confident nonsense, and it will do so faster than a human would.
Importance of Data Quality
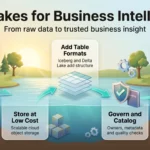
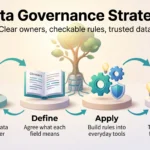
Accuracy depends far more on inputs than on technique. Duplicated customer records, inconsistent product codes and fields that changed meaning after a system migration all show up as model error, usually without an obvious warning. Fixing that is ordinary work: defined ownership, validation at the point of entry, documented definitions. A written data governance strategy keeps those fixes in place after the initial cleanup, and a well-structured data lake stops teams rebuilding the same extracts in parallel.
Gartner’s April 2026 survey is blunt on where this leads: the most data-mature organisations see up to 65% greater business outcomes, while only 23% of IT leaders were very confident in their ability to manage security and governance when deploying generative AI.
Types of Data Used in Predictive Modeling
Predictive models draw on several kinds of input, and most useful models combine more than one:
- Structured data: transactions, orders and CRM records held in databases
- Unstructured data: support tickets, reviews and social posts
- Time-series data: values tracked over time, capturing trend and seasonality
- Text data: free-form writing, usually processed for sentiment or topic
- Geospatial data: location signals used in logistics and site planning
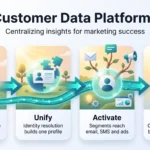
Consented first-party data is the most durable of these. A customer data platform is the usual way to unify it, and behavioural analytics turns the resulting event streams into the features a churn or propensity model actually needs.

Benefits of Predictive Analytics for Businesses
Benefits are concrete when a forecast is tied to a specific decision and vague when it is not. Three hold up in practice, and they are why predictive work keeps appearing in analytics roadmaps.
Enhanced Decision-Making Processes
A ranked list beats a hunch. Scoring accounts by churn risk or leads by conversion probability tells a team where to spend limited hours, a more useful output than a report describing last quarter.
Improved Operational Efficiency
Forecasting inventory, staffing and capacity reduces both shortages and waste. The gains come from smoothing peaks, not from single dramatic predictions.
Increased Accuracy in Predictions
Systematic models reduce forecasting error compared with intuition where volumes are high and patterns are stable. They are least reliable at exactly the moments people most want certainty: structural breaks, new products and unprecedented events. Knowing that boundary is why how results are communicated matters as much as the model.

Predictive Analytics Business Applications Across Industries
The use cases that survive contact with a real budget are sector-specific. Five are well established.
Retail Sector Innovations
Retailers use purchase history and browsing behaviour to forecast demand by SKU and location, driving replenishment, markdown timing and personalised offers. The measurable wins are usually in inventory rather than marketing: fewer stockouts on fast movers, less capital tied up in slow ones. Our overview of analytics in business decision making covers how those models fit wider reporting.
Marketing and Customer Experience
Marketing teams use the same models to decide who to contact and when. Propensity scores rank which prospects are worth a call. Churn scores flag the accounts worth a retention offer. Lifetime value estimates set a sensible ceiling on what a new customer is worth acquiring. The value sits in the ranking rather than in the message: contacting the tenth of a list most likely to convert costs a fraction of contacting all of it. Our guides to AI in marketing and AI personalisation in customer experience cover what the published evidence supports here and what it does not.
Financial Services and Risk Management
Banks and insurers apply predictive models to credit scoring, fraud detection and claims triage. This is the sector with the longest track record here, and the tightest regulatory scrutiny. Models that affect credit decisions have to be explainable, not merely accurate. Our look at predictive analytics in finance goes deeper on that trade-off.
Healthcare Enhancements
Providers use predictive models for readmission risk, capacity planning and identifying patients who would benefit from earlier intervention. The constraints are data governance and clinical validation, not modelling capability.
Industry and Workforce Planning
On the factory floor, predictive maintenance uses sensor data to flag equipment before it fails, replacing fixed service intervals with condition-based ones. In HR, the same statistical logic applied to employee data carries real fairness risk. The concerns set out in our piece on bias in algorithmic recruitment apply to any model scoring people.
Predictive Modeling Techniques Defined
You do not need to implement these to make good decisions about them, but you should recognise what each family is for.
Neural networks (multilayer perceptrons, convolutional and recurrent networks) handle images, audio and language. They are powerful and hard to explain, which limits their use where a decision must be justified to a regulator or a customer.
Decision trees, random forests, Naive Bayes, support vector machines and k-nearest neighbours sort records into categories. Tree-based ensembles remain the default for tabular business data: accurate, fast and reasonably interpretable.
Clustering models such as K-means group records by similarity, which is how customer segments emerge from data rather than from assumptions.

Time-series methods such as ARIMA and exponential smoothing forecast future values from trend and seasonality, and remain the backbone of demand and financial planning.
Ensemble methods such as bagging and boosting combine several models to improve stability. A boosted tree ensemble on clean tabular data beats a neural network on messy data, a useful rule when someone proposes the most advanced option first.
Insights from Predictive Analytics Tools
The tooling question is less about capability than about who will use it.
Popular Predictive Analytics Software Options
Enterprise platforms such as IBM and SAS offer deep modelling and governance features for organisations with dedicated data science teams. Microsoft Power BI, Tableau and comparable tools cover forecasting for analysts inside existing reporting. Open-source Python and R libraries sit underneath most of them. Vendor capabilities and pricing shift frequently, so check current documentation rather than any published comparison, including this one.
Emerging Technologies in Predictive Analysis
Two shifts matter in 2026. Predictions increasingly trigger automated actions rather than sitting in a dashboard, making decision governance a prerequisite rather than a refinement. And self-service tooling is pushing forecasting to non-specialists: fast, but risky without literacy, as our piece on data democratisation argues.
How to Start Without Overcommitting
Most stalled projects begin with a tool purchase. A better order is to pick the decision first, check whether your data can support it, and look at software last.
Start by naming one recurring decision a forecast would change: which accounts get a retention call, how much of a product to order, which overdue invoices to chase first. If nobody would act differently once the forecast arrived, choose a different decision.
Then audit the data behind it. Four questions settle most of the doubt:
- Coverage: does the data describe the outcome you want to predict, or only things around it?
- History: are there enough past examples, including examples of the outcome itself?
- Consistency: have field definitions stayed stable, or did a system migration quietly change what they mean?
- Joins: can the sources be linked on a shared identifier without someone matching records by hand?
An honest answer to those four is worth more than a proof of concept. Our analytics maturity model offers a structured way to score where you currently stand.
Only then does tool choice matter, and the useful criteria are practical rather than technical. Does the tool connect to the systems you already run, or does it need a separate data pipeline nobody has budgeted for? Can the people who will act on the output read it without a data scientist translating? Will it hold up as data volumes grow? Integration is the step teams underestimate most: a model that cannot write its scores back into the CRM or the planning system stays an interesting chart. Our overview of business intelligence tools covers how forecasting features sit inside platforms you may already own.
Where Predictive Projects Go Wrong
The failure patterns are consistent and mostly organisational. A model gets built without a named decision it is meant to change, so nobody acts on it. Training data reflects a process that has since been redesigned. Nobody owns monitoring, so accuracy decays unnoticed. Or the forecast is accurate but arrives after the decision window closed.
None of these are modelling problems, which is why Gartner’s finding about foundational investment is the most useful number here: the organisations getting returns spend on data plumbing, ownership and governance rather than on more ambitious models.
Found this useful?
Make SmartKeys a preferred source on Google, and our articles will surface more often in your Top Stories, AI Overviews, and AI Mode.
Add as Preferred Source