Every click, scroll, search and abandoned cart is a statement of intent. Behavioral analytics is the discipline of reading those statements at scale: what people actually do inside your website, app or product, rather than what they tell you in a survey. Done well, it replaces opinion with evidence and turns customer insights into decisions you can defend.
The commercial case has only strengthened. Third-party tracking has become less reliable, so the behavioral data you collect on your own properties now carries more weight than it did five years ago. Google confirmed in April 2025 that Chrome would keep offering third-party cookies rather than phase them out, and by October 2025 it had retired the remaining Privacy Sandbox APIs, including Topics, Protected Audience and Attribution Reporting. The signal for businesses is the same either way: build your understanding of customers on data you own and can explain.
Key Takeaways
- Behavioral analytics measures observed actions, which makes it harder to fake than stated preference.
- Funnels, session replay, heatmaps and cohort analysis each answer a different question. Pick the tool to fit the question.
- First-party behavioral data has become more valuable as third-party tracking has become less dependable.
- Predictive models are only as good as the event data feeding them, so instrumentation quality decides the outcome.
- Consent, retention limits and transparency are now part of the build, not a legal review at the end.
Understanding Behavioral Analytics
Behavioral analytics tracks how users interact with a digital product and connects those interactions into sequences. Instead of counting pageviews, it asks what a person did first, what they did next, and where they stopped.

The raw material is events: a signup started, a filter applied, a video played to 50%, a payment method changed. Around those events sit properties such as device, plan tier, traffic source and account age. The combination is what makes analysis useful, because it lets you compare how different groups move through the same flow.
Four techniques cover most practical work. Funnel analysis shows where people drop out of a defined sequence. Cohort and retention analysis show whether users who joined in a given week keep coming back. Session replay and heatmaps show the texture of individual sessions, including rage clicks and dead zones. Experimentation, usually A/B testing, tests whether a change actually caused the improvement you observed.
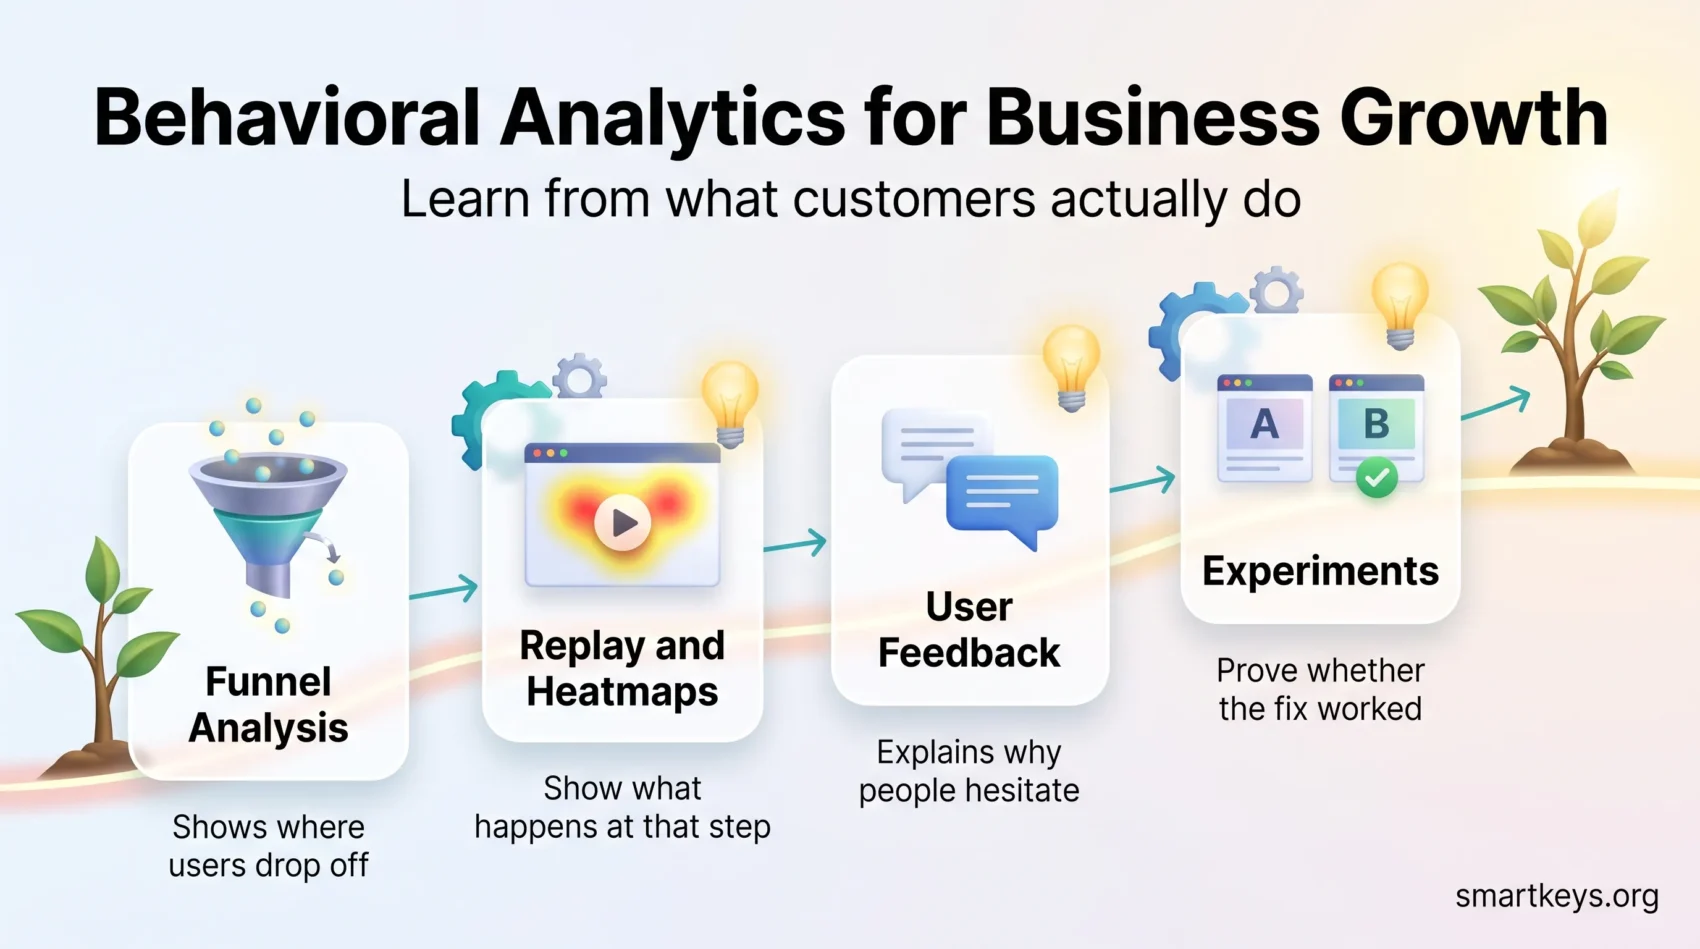
None of these replaces the others. A funnel tells you that 40% of users abandon at the address step; replay and heatmaps suggest why; an experiment confirms whether your fix works. The Internet of Behaviors extends the same logic beyond the screen, into connected devices and physical environments, which raises the stakes on governance considerably.
The Importance of User Behavior Analysis
User behavior analysis matters because self-reported data and observed data often disagree. People say they want more features and then use three. They say price drove the decision and then churn after a support failure. Watching behavior closes that gap.
The practical payoff is friction detection. Path analysis reveals the routes users take that you never designed. Form analytics show which field causes hesitation. Search-term logs inside your own product tell you what people expected to find and did not. Each of these is a specific, fixable problem rather than a vague complaint about usability.
Behavior data also improves segmentation. Demographic segments describe who someone is; behavioral segments describe what they do, which correlates far better with revenue. A “power user who invites teammates in week one” is a more actionable segment than “mid-market customer in retail”.
Where teams go wrong is scope. Instrumenting everything produces a tracking plan nobody understands and dashboards nobody trusts. Start with the two or three flows that carry your revenue, define the events precisely, document them, and expand only when the first set is reliable.
Leveraging Predictive Analytics for Growth
Predictive analytics takes historical behavior and estimates what happens next: who is likely to churn, who is likely to upgrade, which lead is worth a call. Grand View Research valued the global predictive analytics market at USD 18.9 billion in 2024 and projects USD 82.3 billion by 2030, a compound annual growth rate of 28.3%.

Growth in the market is not the same as value in your company. The models that work in practice are usually unglamorous: a churn score built from login frequency, feature depth and support ticket history; a propensity score built from trial behavior. What decides success is whether the event data behind them is complete and consistently defined, not which algorithm you choose.
- Churn and expansion scoring, used to route attention rather than to replace judgment.
- Next-best-action and recommendation logic drawn from browsing and purchase sequences.
- Demand and capacity forecasting from seasonal usage patterns.
- Lead scoring that weights observed product behavior above form-fill declarations.
Two failure modes recur. The first is training on data that no longer reflects reality, for example a model built on pre-launch behavior. The second is a score nobody acts on, which is a reporting exercise dressed as prediction. Decide the intervention before you build the model. Our guide to predictive analytics in business decisions covers the failure patterns in more depth.
Turning Customer Insights into Actionable Strategies
Customer insights only matter when they change something. The gap between a dashboard and a decision is usually organisational, not technical.
Start by joining sources. Product events, CRM records, support tickets and billing data each tell part of the story, and a customer data platform is one way to hold them together under a stable identity. What matters is that “active customer” means the same thing in marketing, sales and support.
Then narrow the question. “Improve retention” produces nothing. “Find out why accounts with fewer than three seats churn in month two” produces a testable hypothesis. Behavioral segmentation makes those questions answerable by grouping people according to purchase frequency, feature adoption and recency.
Personalization is the most common application and the most commonly overdone. Recommendations based on genuine behavior help; recommendations that reveal how closely someone is being watched do not. The distinction is covered in more detail in our look at AI-powered personalization and at personalization in e-commerce.
- Pair every quantitative finding with at least one qualitative source before acting.
- Track a small set of KPIs, such as activation rate, retention curve and acquisition cost, rather than a wall of metrics.
- Write down the decision each report is meant to support. If there is none, retire the report.
Combining behavioral evidence with deliberate retention strategies is what turns analysis into revenue.

How to Implement Behavioral Analytics in Your Business
Implementation is mostly discipline. The sequence below is deliberately small, because most stalled analytics programmes failed by starting too big.
Define Your Goals and Key Performance Indicators
Name the decision first. If the goal is to raise trial-to-paid conversion, your KPI is conversion rate by cohort, not sessions. Set a baseline before you change anything, otherwise you will not be able to tell whether the work paid off.
Map Out Customer Journeys
Sketch the real path from first visit to repeat purchase, including the loops and the exits. This is where you decide which events must exist. Mapping first, instrumenting second, saves months of re-tagging.
Collect and Analyze Data
Write a tracking plan: event name, when it fires, which properties travel with it, who owns it. Use consistent naming and version it. Then validate the data before anyone builds a dashboard on top, because a single mis-fired event can quietly invalidate a quarter of analysis. This is the point where data governance stops being abstract.
Implement Necessary Changes and Measure Results
Ship one change at a time where you can, measure against the baseline, and keep a written record of what you tried. Teams that log their failed experiments learn faster than teams that only publish wins.
Enhancing Customer Engagement through Data-Driven Decision-Making
Engagement work benefits from behavioral data because it lets you target the moment rather than the person. A prompt that fires when someone has used a feature twice but never finished setup is more useful than a monthly newsletter to everyone.
The metrics worth watching are few:
- Retention curve: the share of a cohort still active at day 7, 30 and 90. It flattens or it does not, and the shape tells you whether you have product-market fit in that segment.
- Activation rate: the proportion of new users who reach the action that predicts long-term use.
- Churn and expansion: tracked together, because net revenue movement is what finance cares about.
- Customer lifetime value: useful for allocating acquisition spend, but only when calculated from observed behavior rather than optimistic assumptions.
- Time to value: how long it takes a new customer to get their first meaningful result.
Feedback belongs in this loop as well. Structured survey and support-ticket analysis, including voice of customer programmes, explains the intent that raw event streams cannot. Behavioral data tells you a user hesitated; a support transcript tells you why.
Improving Conversion Rate Optimization with Behavioral Data
Conversion rate optimization is where behavioral analytics pays back fastest, because the flows are short and the outcome is unambiguous.
The method is repetitive on purpose. Find the largest drop-off in a funnel that carries revenue. Look at replays and heatmaps for that specific step. Form a hypothesis about the cause. Test one change. Keep or discard based on the result, not on preference.
Common findings are unremarkable and valuable: a required field nobody expects, a shipping cost revealed too late, a mobile layout that pushes the primary button below the fold, an error message that does not say what to fix.
- Segment before you conclude. A change that helps new visitors can hurt returning customers.
- Run tests long enough to cover a full weekly cycle, and decide the sample size in advance.
- Watch guardrail metrics such as refunds and support contacts, not only the conversion number.
- Fix the biggest leak first, even if a smaller one is easier to ship.
Using Machine Learning Algorithms for Deep Insights
Machine learning earns its place when the pattern is too complex or too high-volume for a human to spot: sequence analysis across millions of sessions, anomaly detection in usage, clustering that finds segments nobody thought to define.
For example, a retailer can analyse browsing and purchasing trends to identify which product combinations predict a second order, then use that to shape recommendations rather than guessing.

Modern tooling has lowered the barrier. Augmented analytics features now surface anomalies and let analysts query data in plain language, and most business intelligence platforms ship some version of this. That convenience creates a new risk: a confident answer to a badly framed question still looks like an answer.
Two safeguards are worth building in. Require that any model influencing customer treatment can be explained in business terms. And check for bias in the training data, because a model trained on the behavior of your existing customers will tend to recommend more of the same customers.
Exploring the evolving field of behavioral analytics shows how quickly the tooling layer changes while the underlying discipline stays constant. The same holds for large-scale customer data work.
The Role of Consumer Behavior Tracking in Business Success
Consumer behavior tracking spans channels: web, app, email, store, support. The value comes from stitching them into one view of a person or account, which is also where most of the difficulty sits.
Quantitative methods give you scale. Qualitative methods, including interviews, usability sessions and open-text feedback, give you the reasoning behind the numbers. Teams that run only one of the two consistently misread their customers.
Cross-channel identity is the hard part. Logged-in users are straightforward; anonymous visitors are not, especially once you respect opt-outs and delete data on request. Be explicit about what you can and cannot join, and avoid building strategy on a match rate you have never measured.
Cross-channel behavior also feeds the systems your commercial teams already use. Current CRM developments increasingly assume product usage flows into the customer record, and wider AI adoption in business operations depends on the same foundation.
Privacy, Consent and What the Rules Require in 2026
Behavioral tracking is regulated activity, and the compliance floor rose again in 2026. Twenty US states now have comprehensive consumer privacy laws in effect, each with its own rules on opt-outs, sensitive data and universal opt-out signals. In the EU, the AI Act’s transparency obligations under Article 50 apply from 2 August 2026, which means people must be told when they are interacting with an AI system unless it is obvious.
Practical consequences for an analytics programme:
- Collect consent before non-essential tracking in jurisdictions that require it, and make the analytics stack respect the answer instead of logging anyway.
- Set retention periods per event type. Raw session replay rarely needs to be kept as long as aggregate funnels.
- Mask sensitive input fields in session recordings by default, not by exception.
- Keep a record of what you collect and why, because access and deletion requests are operational work, not a legal formality.
The strategic response is to lean on data people knowingly give you. A first-party data strategy and, where it fits, zero-party data collected through preference centres are more durable than inferred profiles. For the regulatory detail, see our overviews of data privacy trends and EU AI Act compliance.
Behavioral Analytics as a Foundation for Website Optimization
On the web specifically, a handful of visualisations do most of the work.
Heatmaps aggregate clicks, taps and cursor position, showing which elements attract attention and which are ignored. Scroll maps show how far down the page people actually get, which often explains why a well-written section underperforms. Session replay reconstructs individual visits and is the fastest way to spot a broken interaction that no metric flagged.
Funnel analysis remains the backbone, because it quantifies what the other tools only suggest. Used together, the sequence is straightforward: the funnel says where, replay and heatmaps say what, user feedback says why, and an experiment says whether the fix worked.
Two cautions. Replay is qualitative evidence; a compelling video of one confused user is not proof of a pattern. And heatmaps aggregate away device differences, so segment by breakpoint before redesigning anything.
Layered on top, descriptive analytics summarises what happened, predictive analytics estimates what will happen, and prescriptive analytics suggests what to do. Most teams get more value from doing the first one properly than from buying the third.
Conclusion
Behavioral analytics is less a technology than a habit: instrument the flows that matter, define the events precisely, look at what people do rather than what they say, and change something as a result.
The organisations that get value from it are rarely the ones with the largest data stack. They are the ones that ask narrow questions, validate their data before trusting it, pair numbers with qualitative evidence, and treat consent and retention as part of the design rather than an afterthought.
Start with one revenue-carrying flow. Get its events right, find the biggest drop-off, and fix it. That single loop, repeated, produces more growth than a year of dashboard building.
Found this useful?
Make SmartKeys a preferred source on Google, and our articles will surface more often in your Top Stories, AI Overviews, and AI Mode.
Add as Preferred Source