Last Updated on May 18, 2026
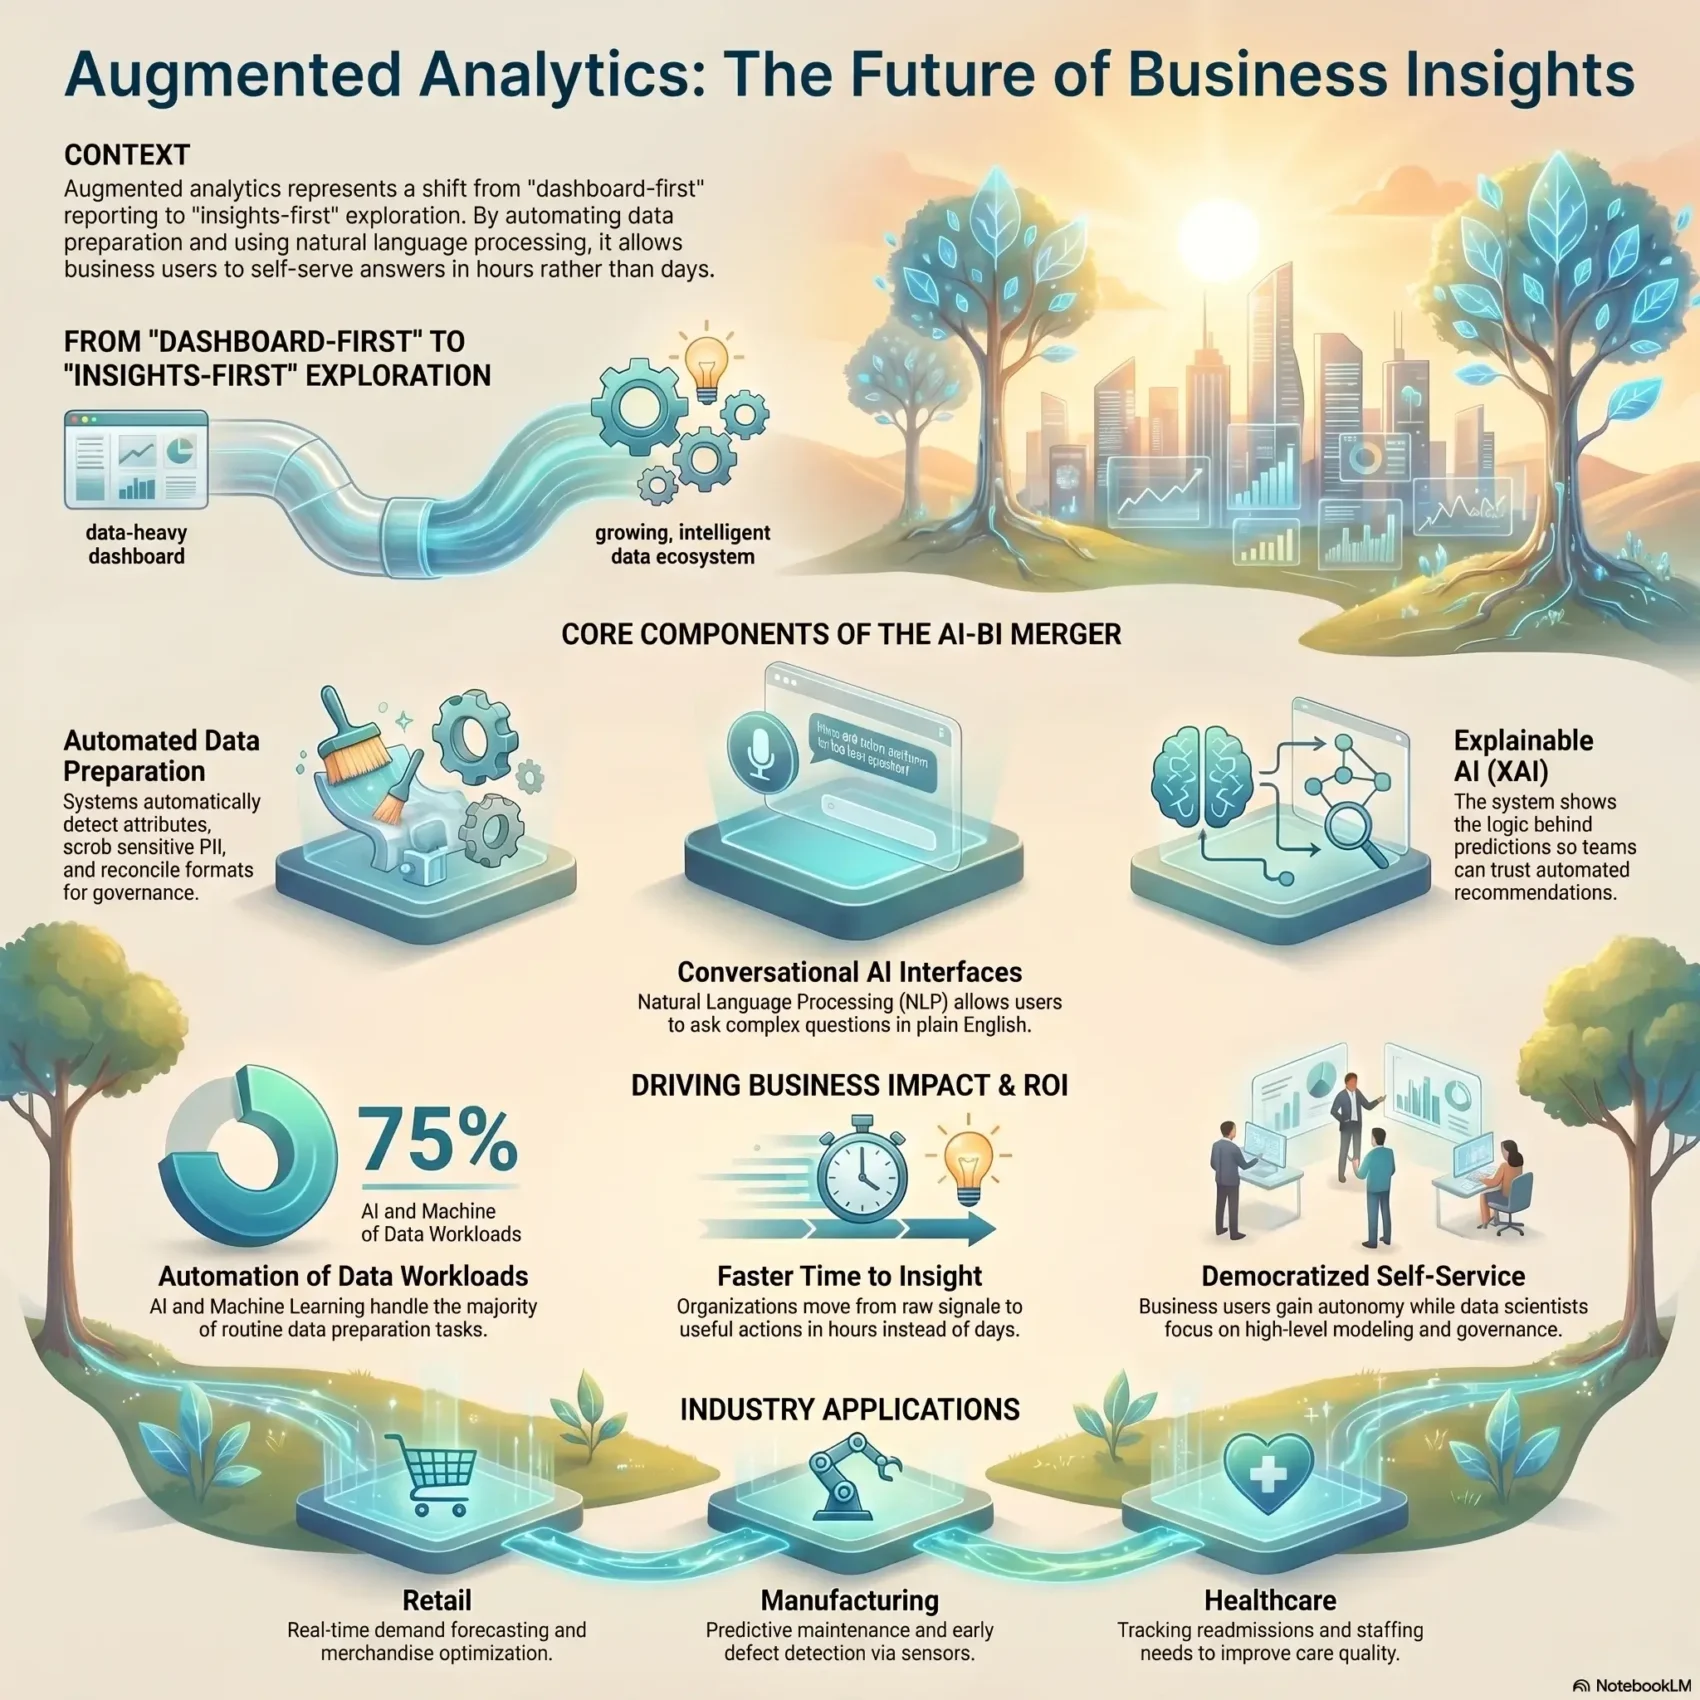
You need clear answers fast. Augmented analytics blends artificial intelligence with business intelligence to turn raw data into meaningful insights. This process automates prep, model choice, and visualization so analysts and business users can self-serve.
Large language models let you ask questions in plain language and get direct results. Machine learning spots patterns in queries and surfaces relevant findings in real time. Automated data cleaning flags items like postal codes or emails, enforces governance, and indexes related information for better retrieval.
This approach shrinks the time from question to answer. Your organization can act faster, with trusted output and governance intact. Tools learn from your team’s behavior, improving relevance and reducing noise as adoption grows.
Key Takeaways
- AI-powered tools help you move from raw data to useful insights quickly.
- Natural language queries let users get answers without technical help.
- Machine learning and algorithms automate cleaning and governance.
- Automated insights highlight trends so your decisions keep pace.
- The system improves over time by learning from user interactions.
What augmented analytics is and why it matters now
A unified approach combines every step of the data lifecycle into one smooth process. You move from collection and cleaning to joining and visualization without switching tools. This full-stack model shortens the path from question to answer.
From data prep to decision-making: a unified view
This approach automates repetitive tasks like detecting inconsistencies, recommending joins, and profiling sources. Automation shrinks the time you spend on data preparation so you can focus on the questions that matter.
How GenAI and NLP open analytics to everyone
Generative AI and natural language let you ask questions in plain English and get clear explanations through natural language generation. Platforms translate your language into the right queries, pick relevant sources, and return charts and text you can act on.
- Algorithms and machine learning find patterns and flag anomalies you might miss.
- Business users can self-serve, while data scientists focus on modeling and governance.
- Faster insights mean better decisions across teams and less time on low-value work.
Augmented analytics vs. traditional BI
Old-school BI often locks answers behind specialist queues, slowing everyday decisions. Traditional systems depend on analysts to prep data, build dashboards, and run scheduled reports. That model works for standardized company reporting but stalls ad-hoc data analysis.
By contrast, augmented analytics automates prep, surfaces automated insights, and lets users explore with natural language. You no longer must wait days for a dashboard change. Instead, guided exploration and conversational tools let teams iterate quickly and test new questions.
Governance still matters. A governed system keeps information trusted while shifting use from static consumption to active interrogation. This balance reduces ticket backlogs and speeds better business decisions across systems.
- Dashboard-first: report-heavy, analyst-led, predictable but slow.
- Insights-first: self-service, automated prep, fast exploration.
- When to use each: routine reports need traditional stacks; ad-hoc exploration benefits from newer tools.
For a practical example of predictive insights that extend decision-making, see predictive analytics for business.
Core components of augmented analytics platforms
Modern platforms combine pipelines, models, and interfaces so you get trusted results faster.
Automated collection, preparation, and governance
Data preparation starts with automated collection that detects attributes, flags PII, and scrubs sensitive fields.
Platforms reconcile formats and index content for vector search so your teams reuse governed assets.
Natural language processing and generation
Natural language processing turns your questions into accurate queries.
Natural language generation then returns clear narratives and charts you can act on.
AutoML, machine learning, and explainable AI
AutoML accelerates model building while machine learning finds trends and patterns across sources.
Explainable AI shows what drives predictions so your team trusts decisions.
Automated insights, statistical analysis, and visualization
Algorithms spot anomalies and surface proactive insights instead of waiting for manual discovery.
Visualization tools recommend chart types based on data shape and intent, saving time and improving clarity.
Descriptive to prescriptive analysis in one system
You can review what happened (descriptive), explore why it happened (diagnostic), forecast outcomes (predictive analytics), and prioritize actions (prescriptive).
This single environment reduces handoffs and speeds reliable decision-making.
The business benefits you can expect
You can cut the wait for answers and turn data into action in hours instead of days. This shift lowers manual toil and speeds decisions, so teams spend less time on prep and more time on impact.
Faster time to insight and reduced manual work
Automated pipelines remove repetitive tasks like joins and cleaning. As a result, your analysts and business users get timely insights and recommended actions.
Democratized analytics for business users and analysts
By broadening access through natural language queries and clear outputs, users self-serve while analysts focus on models and governance. Collaboration improves and backlog shrinks.
Higher data literacy and organization-wide trust
When more people interact with governed datasets, data literacy rises. Teams trust consistent, explainable outcomes and make better decisions across the organization.
Proactive detection of patterns, outliers, and trends
- Platforms flag drops in engagement and surface emerging trends with recommended next steps.
- Combining artificial intelligence and machine learning with human context produces more meaningful insights for business decisions.
Getting ready: data quality, governance, and best practices
Begin with a tight data foundation: consistent definitions, reliable pipelines, and routine checks so you can trust every report and decision. This setup reduces rework and speeds value.
Build a clean, reliable data foundation
Strong governance ensures quality, compliance, and consolidated sources. You should automate profiling and transformations, but keep humans in the loop to validate edge cases and monitor model drift.
Pair AI with human context to drive better decisions
Machine outputs are fast, but business context matters. Invite stakeholders to review results so information reflects real operations and improves trust.
Start small, align to KPIs, and scale adoption
Pick one KPI-aligned use case, prove value quickly, then expand. Train users with just-in-time tips to grow data literacy and reduce resistance.
- Governance first: standard definitions and stable pipelines feed your analysis.
- Human review: analysts validate assumptions and monitor drift.
- Plan for change: allocate time and resources so new tools fit your company workflows.
Common challenges and how to overcome them
Practical rollouts reveal that people, pipelines, and models must be aligned before value appears. You will face familiar hurdles: siloed sources, steep tools, explainability gaps, and bias. Tackle each with focused steps so your team can trust results and act fast.
Data silos, integration, and performance at scale
Unify sources so you avoid partial views that weaken analysis. Prioritize the systems that feed core KPIs and build reliable pipelines.
Plan for efficient processing and resource management so models and queries stay responsive under load.
Tool complexity and gaps in data literacy
Choose consumer-grade interfaces and offer short, task-focused training. Templates and guided workflows help users get value without heavy learning curves.
Trust, transparency, and explainability in AI
Let users trace data lineage, drill into calculations, and review model logic. Transparency boosts confidence across the organization.
- Mitigate bias by widening context, tuning algorithms, and refreshing models regularly.
- Close literacy gaps with targeted education and playbooks that teach better questions and validation steps.
- Prioritize unified systems and scalable processing to keep machine-driven insights timely.
Augmented analytics use cases across industries
Across industries, smart tools turn live signals into actions you can deploy within hours. You’ll see practical use cases that show how data and models move teams from insight to impact.
Retail: Retail teams use purchasing patterns to power demand forecasting and adjust merchandising in real time. This reduces stockouts and improves shelf placement so you sell more during peak seasons.
Healthcare: Hospitals track readmissions, staffing needs, and bottlenecks to boost care quality. Real-time analysis helps you shift resources and cut avoidable returns.
Manufacturing: Line sensors and machine learning spot defects early and predict equipment failures. You cut downtime and keep quality consistent across runs.
- Financial services: Behavioral signals surface fraud and reveal market shifts so your team reacts faster.
- Telecom: Churn prediction flags risky cohorts and guides timely outreach to retain customers.
- Integration: Embedded tools connect with Snowflake, Databricks, and BigQuery so your company acts on fresh information without moving data.
These use cases show how algorithms, clear language, and the right tools help business users make better decisions with less lag time.
What’s next for augmented analytics
Expect instant, context-aware insights that arrive where you work. Real-time expectations rise as teams monitor campaigns and inventory directly in cloud warehouses like Snowflake, Databricks, and BigQuery.
Real-time and streaming insights in the cloud data stack
Streaming pipelines will deliver live dashboards and alerts so you cut response time. You’ll plan for scalable processing and observability to keep systems reliable under load.
Conversational and embedded analytics in daily workflows
Natural language interfaces make analysis feel like a chat. Embedded insights appear in your software and suggest actions that follow business guardrails.
Edge analytics for instant decisions beyond the data center
Edge processing moves intelligence to sites and devices—on a line, in a truck, or at a store. This keeps decisions local when connectivity is limited and speeds operational response.
- Real-time pipelines: streaming dashboards and alerting that shorten time to action.
- Conversational UIs: make data analytics accessible to every team member.
- Edge intelligence: lets machines act immediately at the point of impact.
Conclusion
Turn raw signals into useful actions by pairing fast processing with human review. When machines handle routine prep, you cut delays and improve the quality of your decisions.
The core value comes from unifying automated preparation, natural language, AutoML, and explainable models so teams see what happened, why, and what to do next. This single flow helps you surface clear insights from complex data.
Follow best practices: start with clean sources, enforce governance, and invest in user learning so your analysis stays trustworthy and repeatable.
Adopt friendly tools slowly—prove a KPI, learn fast, and scale what works. The benefits show up as better data analytics, more confident users, and faster business impact.