Most HR teams already have the data they need. It just sits in five systems that never talk to each other. Workforce analytics software is the layer that joins those systems and turns the result into numbers you can act on.
That matters because the questions leaders ask are joined-up questions. Why is turnover higher in one region? Are we paying overtime because of demand or because of a rota problem? Which teams are quietly heading for burnout? None of those can be answered from the payroll file alone.
This guide covers what these platforms actually do and the four categories worth knowing. It also covers what changed in 2026, and how to run a pilot that proves value in a quarter.
Key Takeaways
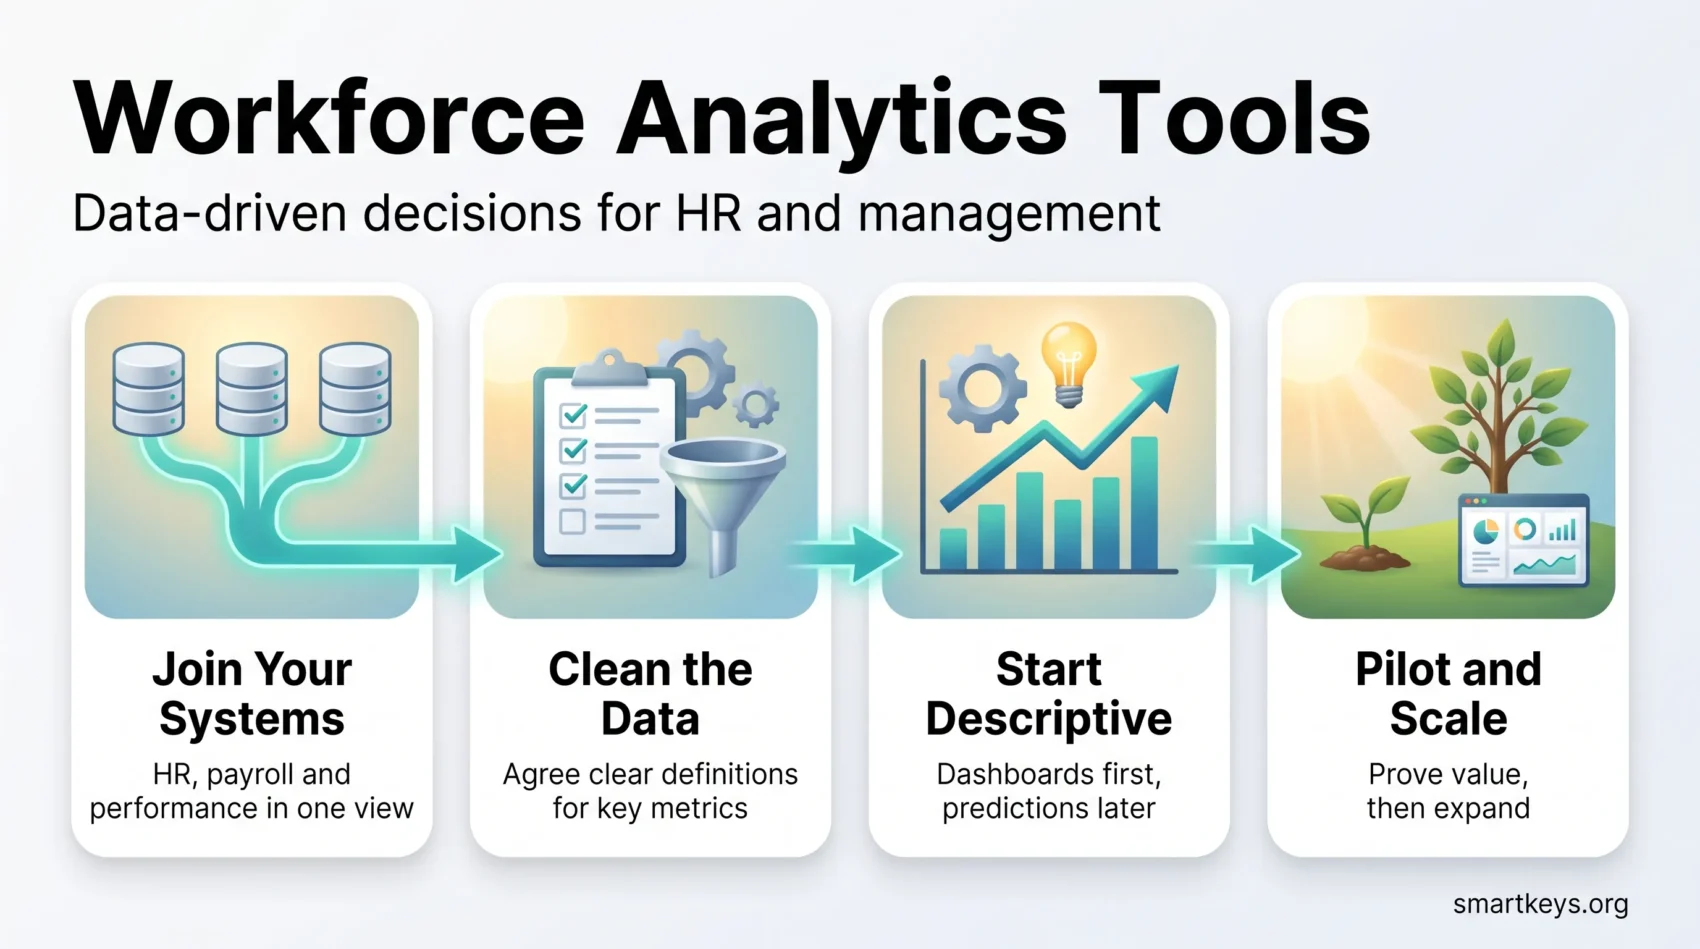
- Join your HR, payroll and performance systems first. Everything else depends on that single view.
- Four categories exist: activity monitoring, business intelligence, people analytics and workforce planning. Most teams need two.
- Start with descriptive dashboards. Move to prediction only once the underlying data is clean.
- Employment AI is now regulated in Illinois, California, New York City and the EU. Check the rules before you buy.
- Run a 60 to 90 day pilot on two or three questions, then scale what worked.
What workforce analytics actually does
Workforce analytics means collecting data about your people from the systems you already run, then using it to answer management questions. It is sometimes called people analytics. The two terms describe the same thing. Both sit inside a broader shift, and our guide to preparing for a data-driven future of work explains the bigger picture beyond HR.
The core move is joining data that normally sits apart. Your HRIS (human resource information system, the master record of who works for you) knows job titles and start dates. Payroll knows hours and cost. The applicant tracking system knows how long a role took to fill. Separately, each is a report. Together, they answer questions like “what does a bad hire in this department actually cost us?”
Once joined, the same data supports three levels of work. Descriptive analytics tells you what happened: headcount fell 4% last quarter. Diagnostic analytics tells you where: almost all of it in one shift pattern. Predictive analytics estimates what happens next: which roles are most likely to lose someone in the next six months.
Most teams get real value from the first two levels long before they need the third. Skipping ahead to prediction on messy data produces confident numbers that are simply wrong. The analytics maturity model is a useful way to work out which stage you are actually at.
The four kinds of workforce analytics software
Vendors rarely describe themselves by category, so it helps to sort them yourself before you take a demo. Each category solves a different problem, and the one you need depends on the question you are trying to answer.
Activity monitoring platforms
Tools such as Teramind and ActivTrak record how work actually happens on company devices: which applications are used, how long tasks take, where handoffs stall. They also flag security risks, such as an employee copying customer records to a personal drive.
The value is operational visibility. A support team can see that agents lose 40 minutes a day switching between two systems that should be integrated. The risk is that the same data reads as surveillance if you introduce it badly. Our guide to AI in employee monitoring covers where the line sits in 2026.
Business intelligence and dashboard tools
Business intelligence (BI) tools such as Tableau and Microsoft Power BI do not know anything about HR out of the box. They are general purpose engines for connecting data sources and building charts. You define the metrics; they render and distribute them.
Pick BI when you need flexibility, when HR data has to sit alongside finance and operations data, or when you already have analysts who know these tools. Our overview of business intelligence tools goes deeper on the trade-offs. The related discipline of data storytelling matters here: a dashboard nobody can read changes nothing.
People analytics platforms
Platforms such as Visier, SAP SuccessFactors and Oracle Fusion HCM Analytics ship with HR metrics already defined. Turnover, time to fill, span of control and internal mobility come pre-built, along with benchmarks and turnover risk models.
The trade is speed against flexibility. You get a working attrition dashboard in weeks instead of months, but you work within the vendor’s definitions. That is usually the right trade for an HR team without a dedicated analyst.
Workforce planning platforms
Planning tools such as Anaplan and IBM Planning Analytics answer forward-looking questions. What does headcount cost look like if we open a second site? What skills will we be short of if the product roadmap lands as planned?
These connect people plans to budgets, so finance is usually a co-owner. They earn their keep in organisations large enough that a headcount decision has a material cost.
The data you need to connect
Nearly every deployment pulls from the same short list of sources. Getting these right is most of the work.
- HRIS: the master record of employees, roles, managers and reporting lines.
- Payroll: compensation, hours and labour cost.
- Applicant tracking: pipeline, time to fill and source of hire.
- Performance and goals: ratings, reviews and objectives.
- Time and attendance: shifts, overtime and absence.
- Engagement surveys: sentiment scores such as employee net promoter score.
The recurring problem is that the same person appears differently in each system. One lists “Sr. Analyst”, another “Senior Analyst II”, a third an internal job code. Until those are reconciled, any cross-system number is guesswork. A written data governance strategy is what stops that drift from creeping back.
A common architecture stages raw data in a warehouse for BI use, then feeds curated, agreed metrics into a people analytics platform. That keeps one version of headcount everywhere.
What changed in 2026
Two things moved this year, and both affect how you should buy.
Agents replaced dashboard hunting
The big product shift is conversational. Instead of finding the right dashboard and filtering it, managers ask a question in plain language and get an answer with the underlying figures attached.
Visier ships this as Vee, an AI agent for people analytics. Salesforce built Tableau Next as an API-first, agent-driven analytics layer that pushes insights into tools such as Slack rather than waiting for someone to open a report. The broader pattern is covered in our piece on augmented analytics.
Treat this as an adoption feature rather than an accuracy feature. An agent answers from whatever metrics you defined. If the definitions are wrong, it just delivers the wrong answer faster and more fluently.
Employment AI became a compliance question
If your platform scores, ranks or flags people, several rules now apply directly.
In the EU, the AI Act classes employment and worker management systems as high risk. The Digital Omnibus agreement then postponed the main high-risk obligations. Standalone systems now have until 2 December 2027, and systems embedded in products until 2 August 2028, according to employment law firm Ogletree Deakins. The delay is not a repeal. Our EU AI Act compliance guide sets out the wider timeline.
In the United States, the picture is a patchwork. Illinois HB 3773 took effect on 1 January 2026 and requires employers to tell staff and applicants when AI is used in hiring, firing, discipline, promotion or training decisions. California’s FEHA regulations on automated decision systems took effect on 1 October 2025 and let regulators weigh whether bias testing was done at all. Colorado’s AI Act was rewritten and now takes effect on 1 January 2027. New York City’s Local Law 144 still requires notice and an independent bias audit for automated hiring tools. These dates are summarised by law firm Epstein Becker Green.
The practical consequence is simple. Ask vendors for documentation of how their models work and what bias testing exists, and get it in writing before you sign. Our guide to AI hiring tools covers the questions worth asking.
How to choose a platform
Start from the decisions you need to make, not the feature list. Write down three questions leadership asks every quarter. Then check which platform answers them with the data you actually hold.
Capability checklist
- Integrations: native connectors to your specific HRIS and payroll systems, not just “an API”.
- Metric definitions: can you see and change how turnover is calculated? Vendors differ on whether internal moves count.
- Reporting: scheduled exports, drill-downs and embedded views for managers who will never log in.
- Access control: role-based permissions so a line manager sees their team and not the whole company.
- Scale: query speed at your real data volume, tested during the trial rather than promised.
Privacy by design
Look for role-based access, field-level redaction (hiding specific columns such as salary or health-related absence from most users), and audit logs showing who viewed what. Confirm where the data is physically stored, since that determines which privacy laws apply. The rules that now govern employee records are covered in our guide to data privacy at work.
Cost and time to value
Total cost of ownership is licences plus integration work plus the internal time to maintain it. That third item is the one most business cases miss.
Pre-built platforms reach a working dashboard faster. Custom BI models cost more up front and pay back if you have unusual questions. A short pilot with two or three scored use cases will tell you which side you fall on more reliably than a vendor demo.
Three use cases you can run this quarter
Each of these fits in a few weeks and uses data you already have.
Find the workload problems before people resign
Combine hours, overtime and absence data by team. Look for sustained patterns rather than single bad weeks: a team running 15% above its normal hours for two months is a signal worth acting on.
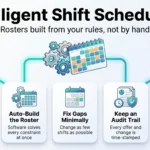
Set alerts so managers see the pattern while they can still fix it. The fix is usually rebalancing work or reviewing the rota, which is where intelligent shift scheduling helps. This connects directly to what drives engagement in distributed teams.
Score turnover risk for one role family
Pick a single population where losing someone hurts, such as experienced field engineers. Build a model on your own history and start with drivers you can explain: time since last promotion, pay position against band, manager changes, commute distance.
Explainability matters more than accuracy at this stage. A manager will act on “this person has not moved in three years and sits below band” but not on an unexplained risk score. Pair each flagged case with a specific retention play. Our guide to predictive analytics in employee management covers how to build these responsibly, and talent retention strategies covers the interventions themselves.
Build one headcount scenario
Model next year’s headcount under two assumptions rather than one: the plan as written, and the plan with 20% less budget. Include the skills you would be short of in each case.
The output is not a forecast. It is a conversation with finance grounded in the same numbers. A digital skills gap analysis makes the second half of that conversation concrete.
Security, privacy and governance
People data is among the most sensitive an organisation holds. Treat access as a design decision, not an afterthought.
Give each role the narrowest view that lets it do the job. Redact personal identifiers in exported reports and logs. Review who has access on a schedule rather than when someone asks, because permissions granted for a one-off project tend to stay forever.
Governance also means transparency with the people in the data. Write down what you collect, why, and who sees it, then publish it internally. A data literacy programme helps here for a practical reason: employees who understand what a metric measures are far less likely to assume the worst about it.
Aggregate where you can. Most management questions are answered at team level. Individual-level data should be the exception you can justify, not the default.
Rolling it out without losing the room
The technical work is rarely what sinks these projects. Trust is.
Get the data ready first
Standardise job codes, departments and date formats across systems before you connect anything. Agree written definitions for your top ten metrics and store them where anyone can find them. Decide, for instance, whether an internal transfer counts as turnover, because two teams will otherwise report two different numbers.
Bring people with you
Run a 60 to 90 day pilot with named owners in HR, IT and finance. Publish what you are measuring and why before the first dashboard goes live.
Train managers on interpretation, not just navigation. The common failure is a manager who sees a red indicator, does not understand the definition behind it, and either panics or ignores it. Wider access works best alongside self-service analytics that people are actually equipped to use.
Keep improving
Automate the weekly refresh so nobody rebuilds a report by hand. Review metric definitions quarterly, because reorganisations quietly break them. Retire dashboards nobody opens.
Feed what you learn back into how you manage people. Analytics that never changes a decision is an expensive reporting habit. Linking it to continuous performance management and to DEI tech tools is how the numbers turn into practice. For the wider context, see our overview of HR management trends in 2026.
Conclusion
Workforce analytics tools are worth the effort when they change a decision. That is the only test that matters.
Start narrow. Pick one question leadership already asks, connect only the data needed to answer it, and publish the result on a schedule people can rely on. Clean definitions and honest reporting beat a sophisticated model built on records nobody trusts.
Then expand slowly. Add prediction once the descriptive numbers hold up. Add planning once finance is in the room. Keep the privacy controls ahead of the ambition, because in 2026 the rules on employment AI are tightening rather than loosening.
Found this useful?
Make SmartKeys a preferred source on Google, and our articles will surface more often in your Top Stories, AI Overviews, and AI Mode.
Add as Preferred Source