Your retention numbers have probably never looked better — and that is exactly the problem. The U.S. quit rate has sat at or below 2.0% a month for roughly a year, well under the 3.0% peak of the Great Resignation. Fewer people are walking out the door. Far fewer of them are actually engaged.
Gallup’s 2026 State of the Global Workplace report puts global engagement at 20% for 2025, the lowest reading since 2020 and three points below the 2022 high, with roughly $10 trillion in lost productivity attached to it. At the same time, close to half of U.S. workers say they are staying in their current role longer than they otherwise would — for security, not satisfaction. Analysts call it “job hugging.”
That changes the question you need to answer. It is no longer “how do we stop people from leaving?” It is “how do we make sure the people who stay are the ones we want, doing work they care about — before the market loosens and leaving becomes easy again?”
This guide gives you the current numbers, the cost math that survives a CFO conversation, and the specific levers — pay, managers, culture, career paths, and flexibility — that move retention in 2026.
Key Takeaways
- Low turnover in 2026 often signals a frozen labor market, not a healthy workplace — measure engagement alongside retention.
- Replacing an employee typically costs between half and twice their annual salary; recruiting alone averages about $4,700 per hire.
- Manager engagement fell to 22% globally and is now the clearest single predictor of team attrition risk.
- Career growth and internal mobility outperform perks: organizations rank learning as their number-one retention strategy.
- Treat retention as a measurable process — stay interviews, cohort tracking, and quarterly pay benchmarking beat annual surveys.
Talent Retention in 2026: Why Low Turnover Is Not Automatically Good News
When people stay, you keep institutional knowledge, protect customer relationships, and avoid replacement costs. That only holds if they stay for the right reasons.
Retention and commitment have come apart
A stable headcount is no longer proof of a healthy culture. Surveys through early 2026 found that more than half of U.S. workers identify with staying put out of caution — layoff anxiety, AI uncertainty, and a slower hiring market rather than genuine attachment.
The risk is delayed, not avoided. When conditions improve, the people who have been quietly disengaged for two years are the first to move, and they are rarely your weakest performers. Tracking current employee engagement trends alongside your turnover rate is the only way to see this coming.
What the labor data actually shows
The numbers below give you a defensible baseline for planning conversations:
- Quits: 3.2 million in June 2026, a 2.0% monthly rate (BLS JOLTS, released 4 August 2026).
- Job openings: 7.4 million — functioning, but well below post-pandemic peaks.
- Layoffs: 1.8 million, a 1.1% rate, still historically low.
- Median tenure: 3.9 years as of January 2024, the lowest the BLS has recorded since 2002.
- Hiring difficulty: 72% of employers globally and 69% in the U.S. report trouble filling roles (ManpowerGroup 2026), with AI skills now the hardest to find anywhere.
Read those together and the picture is specific: churn is low, but the roles you most need to fill are still hard to fill. Losing one senior specialist in 2026 hurts more than losing three generalists did in 2021.
What Turnover Actually Costs Your Organization
There is no single turnover number, because the cost scales with the role. Use the benchmarks below to build a defensible estimate rather than quoting a headline figure.

| Cost component | Typical benchmark |
|---|---|
| Direct recruiting (ads, agency, screening) | ~$4,700 per hire; median time-to-fill around 44 days (SHRM) |
| Full replacement cost | 50%–200% of annual salary depending on seniority (Gallup) |
| Entry-level departure | Roughly 33% of salary, about $15,000 at median wages (Work Institute) |
| Manager or specialist departure | $50,000–$200,000+ once ramp time and lost output are included |
| Total U.S. voluntary turnover | Over $1 trillion a year (Gallup) |
The hidden half is what auditors rarely see: knowledge that walks out undocumented, the colleagues who absorb the extra workload, and the customer relationships that quietly cool during a 44-day vacancy. Mapping which roles carry that exposure is the same exercise as workforce contingency planning — do it once and both problems get easier.
Why Employees Leave — and What You Can Actually Fix
Most departures are preventable. The Work Institute’s exit research has consistently found that roughly three-quarters of exits trace back to something the employer controlled — a number that has barely moved in a decade.
The drivers worth ranking first
Departing employees keep naming the same five: limited development, unsustainable workload, a weak or absent manager, poor working conditions, and compensation that has drifted below market. Rank these by impact for your own teams instead of assuming the industry average applies to you.
One caution for 2026: the pay driver has become harder to see. In a slow market, people who feel underpaid complain less and leave later — the resentment simply compounds. Regular benchmarking and clear pay transparency practices surface the gap before it turns into a resignation.
Early warning signs your managers should be watching
- Withdrawal from optional work: fewer volunteers for stretch projects, quieter in meetings.
- Rising absence, missed deadlines, or a drop in the quality of work that used to be effortless.
- Sustained overload with no recovery period — the reliable precursor to burnout.
- Compensation that has slipped below the market median for the role.
- Long tenure in a role with no visible next step.
Low quit rates tell you people did not leave. They do not tell you why they stayed.
The Framework: Fix the Irritants First, Then Build the Motivators
Herzberg’s two-factor model is still the fastest way to sort a messy engagement survey. It separates the things that make people dissatisfied from the things that make them committed — two different problems with two different fixes.

Hygiene factors versus motivators
Hygiene factors — pay, policies, tooling, working conditions, basic fairness — do not inspire anyone when they work. They drive people out when they fail. Motivators — growth, meaningful work, autonomy, recognition — are what create actual commitment.
Fixing a motivator problem while a hygiene problem is live never works. Nobody is inspired by a mentorship program when their pay is 12% below market or their laptop takes six minutes to boot.
Turning the diagnosis into programs
- Diagnose: run a short pulse survey that tags each item as an irritant or a motivator.
- Clear the irritants: correct pay gaps, fix broken policies and tools, remove approval bottlenecks. These are quick and visible.
- Then build: launch career paths, recognition rituals, and role redesigns tied to real business goals.
- Enable managers: train them to raise both categories in one-to-ones instead of waiting for the annual survey.
- Score it: track each factor monthly and connect the movement to retention by team.
Pay, Benefits, and Total Rewards That Hold Up
Compensation rarely wins loyalty on its own, but it reliably ends it. Start with defensible market pay, transparent rules, and benefits that match how people actually live.
Benchmark, review, and audit on a schedule
Benchmark by role and market at least annually and set a published review cadence so employees are not left guessing. Run pay-equity audits alongside it and correct what you find quickly — an unexplained gap discovered by an employee costs far more than one you fix yourself.
For distributed teams, decide deliberately whether you pay for the role or for the location. The tradeoffs in global pay parity for remote workers are real, and an undocumented policy here becomes a fairness complaint later.
Benefits that measurably influence staying
Health coverage, mental health support, retirement contributions, tuition assistance, and childcare or elder-care help consistently rank highest. Flexible spending options such as employee wellbeing stipends let people direct the money where it matters to them, which is why they outperform fixed perks in distributed teams.
Connect reward to contribution — carefully
Variable pay works when the goals are measurable and the rules are stable. If you are considering it, the design questions in performance-based pay models matter more than the payout percentage.
Finally, publish a plain-language total rewards statement. Employees routinely undervalue their package by thousands of dollars simply because nobody adds it up for them.
Managers Are Still the Single Biggest Retention Lever
The clearest finding in Gallup’s 2026 data is that managers are the problem and the fix at the same time. Manager engagement fell to 22% in 2025, down from 27% a year earlier and 31% in 2022. The historic “engagement premium” managers held over their teams has almost vanished.
That matters because disengaged managers cannot generate engaged teams. In the organizations Gallup identifies as best-practice, manager engagement reaches 79% — nearly four times the global average, and the difference is deliberate investment rather than luck.
What to actually train
Skip the generic leadership workshop. The skills that show up in retention data are coaching conversations, workload triage, giving feedback that changes behavior, and handling conflict before it calcifies. Teach them through role play and shadowing, not slide decks.
Give managers dashboards showing engagement, tenure, and pay position for their own team, and hold them accountable for those signals. For the broader capability set leaders need next, see leadership skills for tomorrow.
Make feedback continuous
Annual reviews are too slow to catch a disengaging employee. Short, structured, frequent check-ins with a clear outcome each time work better — and they cost less. Pair them with recognition that is specific and timely rather than quarterly and generic.
Where decisions allow it, involve the team directly; the ownership effect described in participatory management is one of the cheaper motivators available to you.
Culture and Inclusion People Actually Feel
Respect and a sense of being valued rank alongside pay in why people stay. Culture only counts when it shows up in decisions, not on a wall.
Psychological safety is a management behavior, not a value statement
People speak up when disagreement has visibly been safe before. Build the rituals that prove it — blameless post-mortems, leaders naming their own mistakes first, questions welcomed in public rather than redirected to DMs.
Operationalize inclusion
Run pay-equity analyses, document promotion criteria, and use structured interview panels. Then track outcomes by group and publish what you find internally. Stated values without measured outcomes reliably increase cynicism rather than reduce it.
Close the loop on feedback
The fastest way to kill an engagement survey is to run it and change nothing. Report back what you heard, what you are changing, and what you are explicitly not changing and why. The last category buys more credibility than most leaders expect.
Career Paths, Skills, and Internal Mobility
Growth is the retention lever with the strongest evidence behind it. LinkedIn’s workplace learning research found 88% of organizations concerned about retention, with learning opportunities ranked as the number-one retention strategy — yet only about a third qualify as genuine career-development organizations.

The skills pressure is real too. The World Economic Forum expects 39% of core workplace skills to shift by 2030, and 63% of employers already name skills gaps as their biggest barrier to transformation.
Make the next step visible
Publish skills ladders and promotion criteria. Post roles internally before externally. Make lateral moves normal rather than suspicious. Companies with strong internal movement retain people substantially longer, and an internal talent marketplace is the mechanism that makes it work at scale.
Watch for talent hoarding — managers quietly blocking transfers is one of the most common reasons a mobility program fails. Some organizations now track and reward managers who export strong performers to other teams.
Train for the skills you will actually need
Start with a real inventory of what your workforce can do rather than what job titles imply; the method in digital skills gap analysis gives you that baseline. Then tie learning to live projects so it compounds instead of expiring.
Use mentoring to move knowledge
Structured mentoring transfers the context that documentation never captures and shortens ramp time for new hires. Pairing at scale is a solved problem — mentorship matching platforms handle it — and peer learning platforms extend the same effect across teams.
Flexibility and Workload That Protect Well-Being
Flexibility is now a baseline expectation, and removing it reads as a pay cut. Define which arrangements apply to which roles, publish the eligibility rules, and apply them consistently — inconsistent flexibility does more damage than no flexibility.
Design the options deliberately
Remote, hybrid, and flextime each solve different problems. Compressed schedules are worth evaluating on evidence rather than enthusiasm; the pilot results summarized in the four-day workweek are more mixed than the headlines suggest. The same applies to leave design — the tradeoffs of a flexible PTO policy include people taking less time off, not more.
Manage workload before it becomes burnout
Rebalance tasks actively, judge output rather than hours logged, and set explicit norms for after-hours contact. Regulation is moving in this direction anyway — the expectations behind the right to disconnect are spreading, and getting ahead of them is cheaper than complying under pressure.
Make Retention a Measurable Process
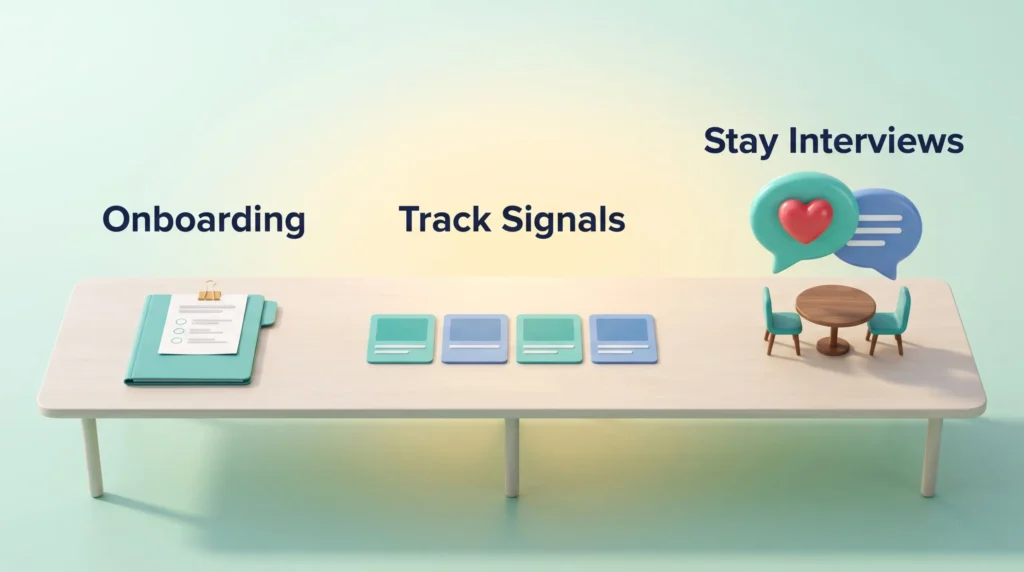
Treat retention like an operating process with inputs, checkpoints, and owners. Good intentions do not survive a busy quarter; a process does.
Hire and onboard for the first 90 days
A slow, silent hiring process predicts early attrition. Respond quickly, set realistic expectations, and start onboarding before day one. Structured milestones through the first quarter measurably reduce first-year churn.
Track the right signals
Monitor turnover by cohort and tenure band, not just company-wide. Add engagement scores, internal mobility rate, time-to-fill, and pay position against market. A stable overall number can easily hide a 30% loss rate in one critical function.
Run stay interviews, not just exit interviews
Exit interviews explain what you already lost. Stay interviews — short, structured conversations with people you want to keep — tell you what to fix while fixing it still helps. Ask what would make them consider leaving and what would make them certain to stay.
Benchmark against the market, quarterly
Compare pay, benefits, and flexibility policies against direct competitors on a schedule. Broader shifts in how the function operates are worth tracking too; the future of human resources outlines where the practice is heading.
Your First 90 Days: A Practical Sequence
- Weeks 1–2: Pull turnover by team, tenure band, and role criticality. Identify the ten people whose exit would hurt most.
- Weeks 3–4: Run a pay benchmark on those roles and correct anything below market immediately.
- Weeks 5–6: Hold stay interviews with that group. Ask about growth, workload, and manager quality specifically.
- Weeks 7–8: Fix the irritants that surfaced. Publish what you changed.
- Weeks 9–12: Launch one motivator program — usually a visible career path or an internal mobility opening — and set the metrics you will review each quarter.
Conclusion
Retention in 2026 is a quality question, not a volume question. Your turnover rate looks fine because the market is slow; the number that matters is whether the people staying are committed or merely waiting.
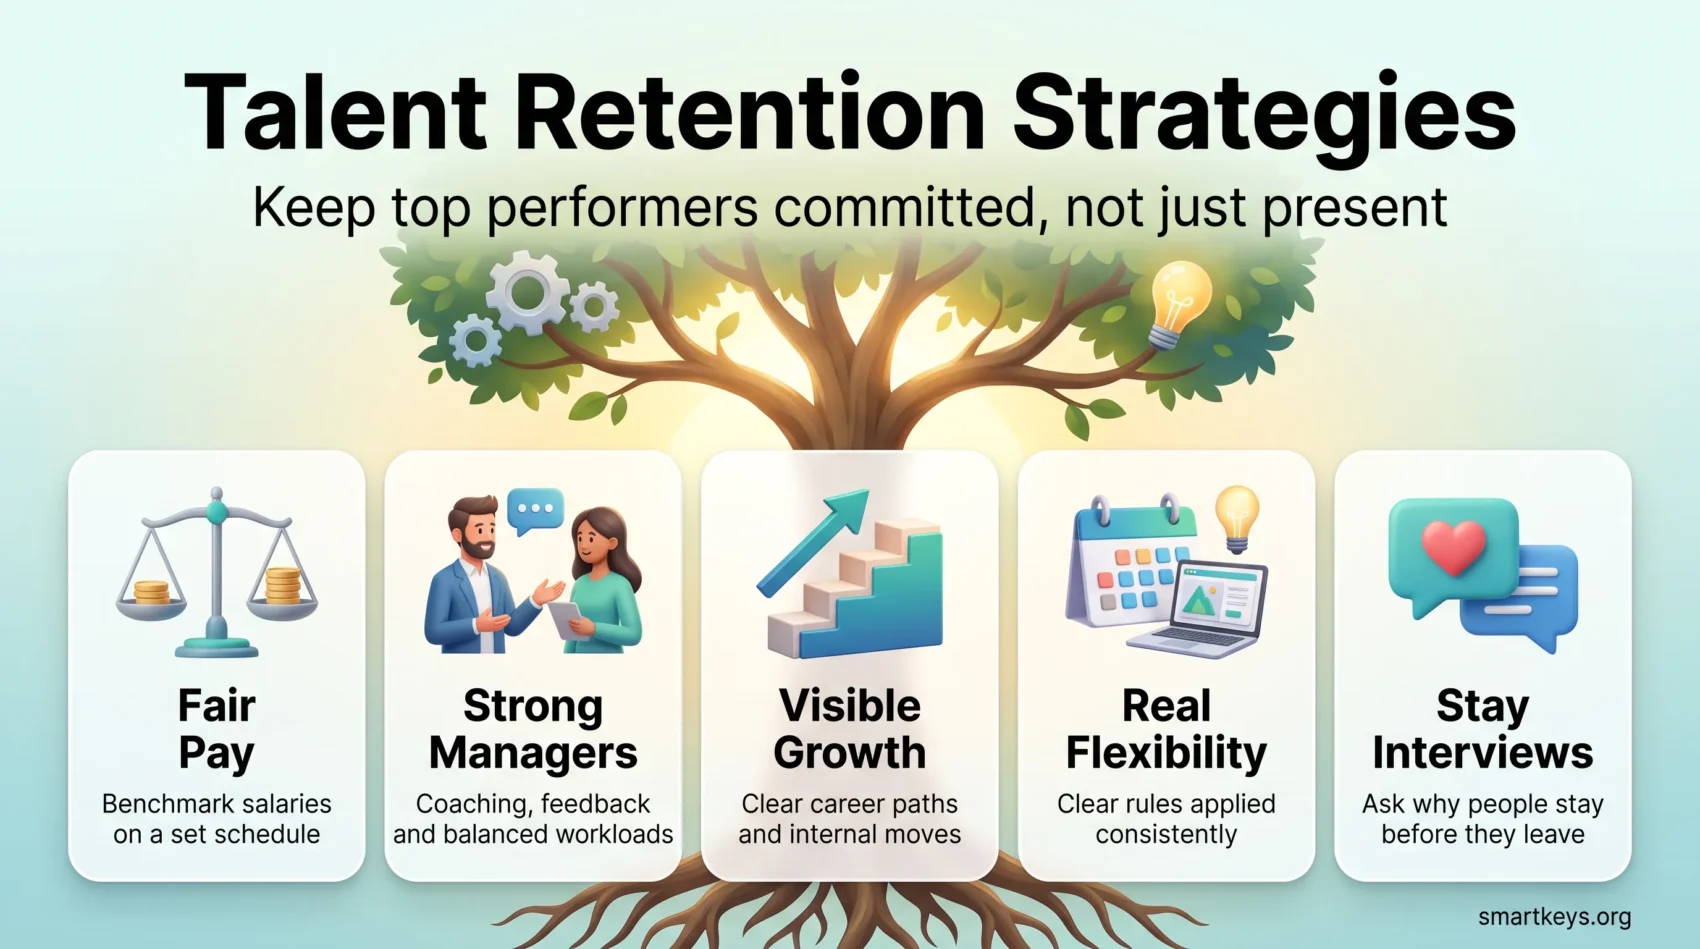
The levers have not changed as much as the context has. Fair pay reviewed on a schedule, managers who are supported rather than just held accountable, a culture people can feel in decisions, a visible next step, and workload that leaves room for a life — these still explain most of the variance between organizations that keep their best people and those that lose them.
What has changed is the urgency of measuring properly. Track engagement alongside retention, run stay interviews before exit interviews, and act on what you hear within the quarter. Do that consistently and you will still have your top performers when the market opens up and everyone else discovers who was only job hugging.
Found this useful?
Make SmartKeys a preferred source on Google, and our articles will surface more often in your Top Stories, AI Overviews, and AI Mode.
Add as Preferred Source