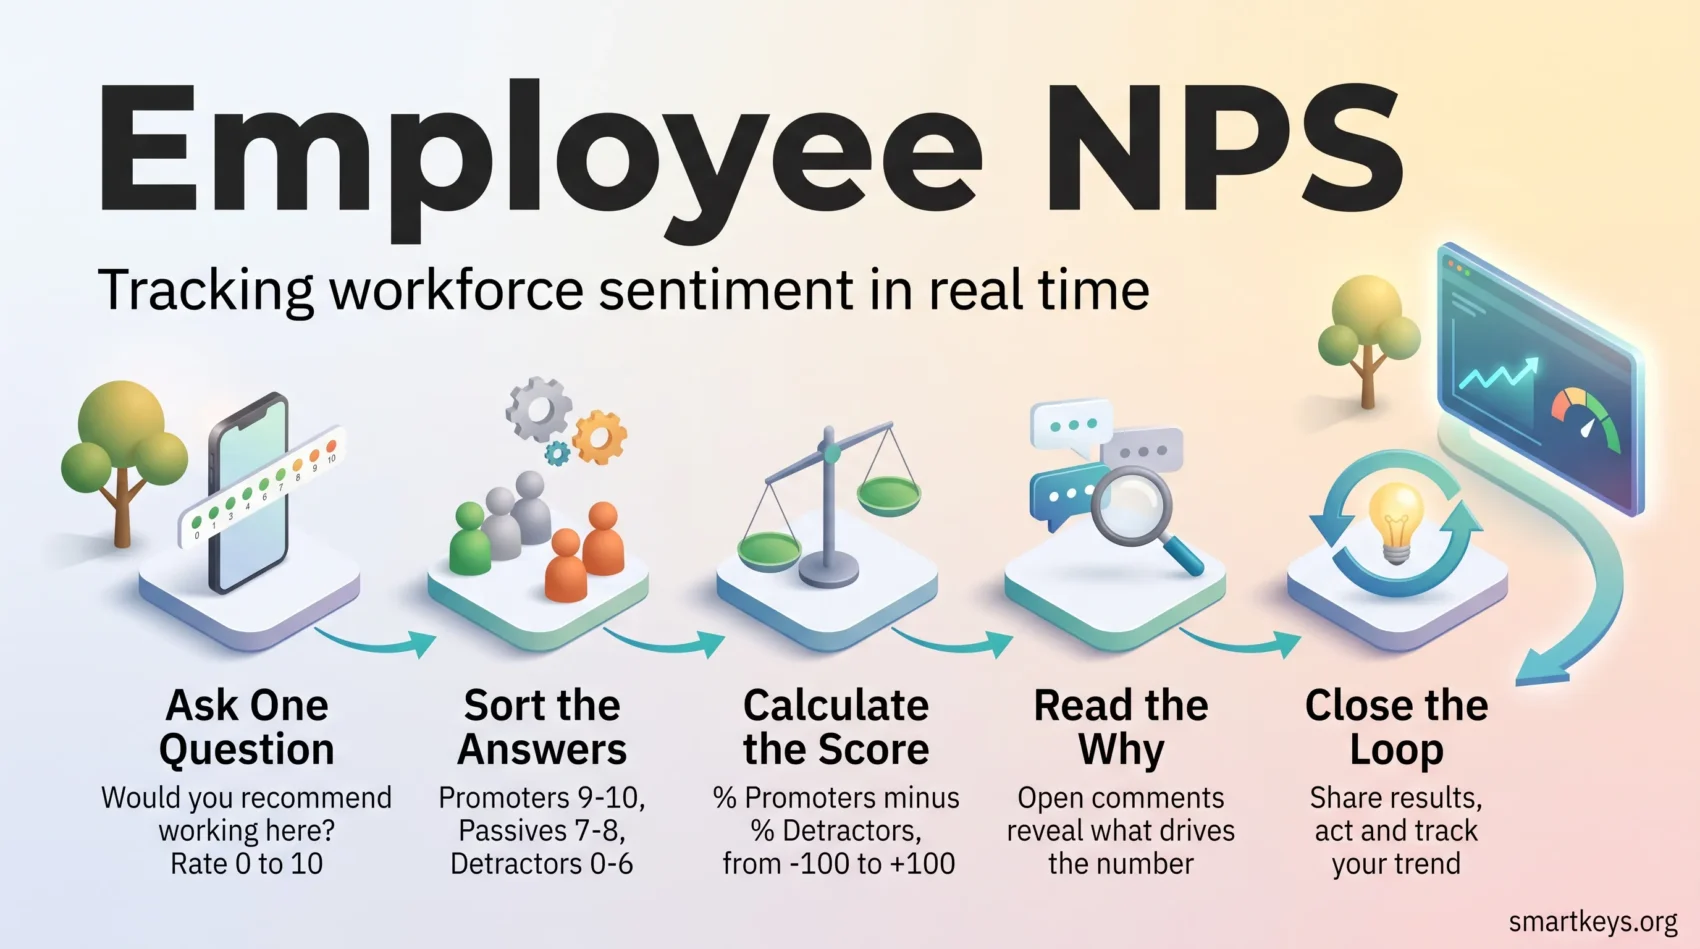
Employee Net Promoter Score (eNPS) tells you, with a single question, how your people feel about working for your company. Employees rate from 0 to 10 how likely they are to recommend your company as a place to work. You subtract the share of critics from the share of fans and get a score between -100 and +100.
That simplicity makes eNPS a practical survey tool for regular pulse checks. It takes a minute to answer and a few minutes to calculate. Published benchmarks vary widely depending on who collected the data, so the trend in your own results matters more than any single number.
Use eNPS to move beyond guesswork. The score links everyday sentiment to engagement, retention, and business results. When leaders act on what they hear, the whole workplace can become more productive.
Key Takeaways
- eNPS is a one-question tool scored from -100 to +100.
- It pairs a numeric rating with a short open comment that explains the number.
- Benchmarks give context, but your own trend line tells the real story.
- Regular tracking ties sentiment to engagement, retention, and outcomes.
- Sharing results and acting on them builds trust and lifts future response rates.
What this guide to employee NPS covers
This guide walks you from the definition to action. You get the math behind the score with worked examples, current benchmarks by industry and company size with their sources, and practical advice on survey design, cadence, and segmentation. The final sections cover how to raise response rates, where the metric falls short, and which tools help you run it at scale.
Understanding the employee net promoter concept
A single survey question can act as an early warning light for culture and engagement.
Where it comes from: The idea started in customer research. Fred Reichheld of Bain & Company introduced the Net Promoter Score in a 2003 Harvard Business Review article as a way to measure customer loyalty with one question. HR teams later adapted it for employees, and the “e” in eNPS marks that shift.
What it measures: An eNPS survey asks one clear question: “On a scale of 0-10, how likely are you to recommend working at this company to a friend or colleague?”
Responses sort into three groups: Promoters (9-10), Passives (7-8), and Detractors (0-6).
Why it matters right now
This metric captures whether people would recommend your workplace to someone they know. That kind of advocacy reflects loyalty and satisfaction.
The wider picture makes a cheap, frequent signal valuable. Gallup’s State of the Global Workplace 2026 report puts global employee engagement at 20% for 2025, down from a peak of 23% in 2022. Gallup estimates that low engagement cost the world economy roughly $10 trillion in lost productivity. For the bigger context, see the current employee engagement trends. A regular eNPS pulse helps you spot a slide in your own company before it shows up in resignations.
How it differs from customer net promoter
Both versions use the same 0-10 scale and the same math: %Promoters minus %Detractors. The focus simply shifts from buyers to staff.
The two often move together. When your people are promoters, customer experience tends to improve too, because engaged employees solve problems faster and stay longer. Watching both signals shows how culture and service are connected.
How eNPS works: the core question, scale, and categories
Start with one straightforward question and a consistent scale so you can compare results over time. Below you get the exact wording and practical rules for scoring.
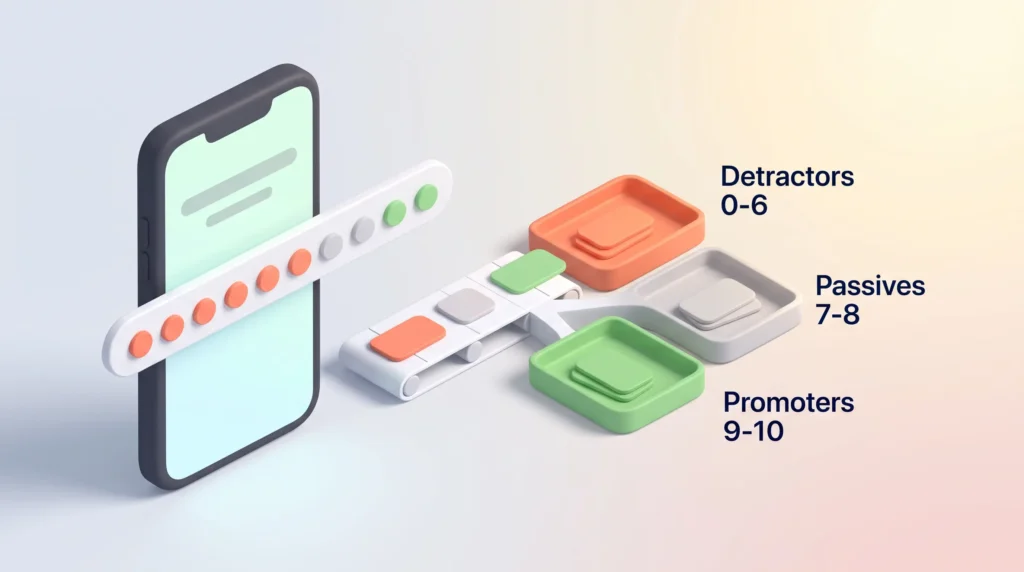
The standard question and the 0-10 scale
Core question: “On a scale of 0-10, how likely are you to recommend working at this company to a friend or colleague?”
Present the same 0-10 scale every time to keep results comparable. A clear layout and a completion time of one to two minutes help response rates for your eNPS survey.
Promoters, Passives, and Detractors explained
Responses break into three groups: Promoters (9-10), Passives (7-8), and Detractors (0-6). Promoters signal strong advocacy. Detractors flag problems you need to address.
The score uses %Promoters minus %Detractors. Passives drop out of the formula, but they still matter. A large passive group is a pool of people who could tip either way, so watch it in your trend analysis.
- Keep the wording exact to avoid biasing the question and scale.
- Pair the rating with a short open prompt so you get context, not just a number.
- Use reporting guardrails (a minimum group size) to protect anonymity.
Calculating your eNPS score step by step
Convert response counts into percentages, then subtract detractors from promoters. That is the whole calculation.
Formula and quick math examples
eNPS = %Promoters − %Detractors. If 60% of respondents are promoters and 15% are detractors, the eNPS score is 45.
You can work with raw counts or percentages. Example: a company of 60 people with 30 promoters, 20 passives, and 10 detractors gives:
- (30 − 10) / 60 × 100 = 33.3, so the eNPS score is 33.3
- A 1,000-person survey with 400 promoters and 450 detractors gives (400 − 450) / 1,000 × 100 = −5
Interpreting positive, neutral, and negative results
Positive scores show advocacy and often go together with higher retention and morale.
Scores near zero mean you should dig into the comments and segment results by team or location. The average hides where the problem sits.
Negative scores signal risk and call for targeted action plans. Watch for volatility in small groups: in a team of eight, one person changing their answer moves the team score by 12.5 points. Set minimum response thresholds before you publish any roll-up.
What is a good eNPS? Ranges, thresholds, and context
Knowing what each range means helps you prioritize actions and set realistic goals. The scale runs from -100 to +100, and each band signals a different level of advocacy and risk.
Score ranges from -100 to +100 and what they signal
Anything above zero means more promoters than detractors. Many practitioners call 10-30 good, 50-70 excellent, and above 80 exceptional. SurveyMonkey uses a similar ladder: below 0 needs improvement, 10-30 is average with positive sentiment overall, and above 50 is excellent.
Keep context in mind. Industry, labor market, and company size all shape what is realistic. Use response rates and confidence intervals (the margin of error around a survey result) to judge whether a change is meaningful or just noise.
Why “better than last time” beats chasing external averages
Trend beats target. Improvement over time shows real momentum. A small upward move after a concrete change can matter more than a high but flat benchmark.
- Focus on sustained improvement and root causes.
- Expect swings during reorganizations or busy seasons.
- Align leaders so a single-point dip does not cause panic.
Current eNPS benchmarks by industry and company size
Benchmarks give context, not answers. Use them to frame conversations about your culture and retention, then rely on your own trends to guide action. One warning up front: published eNPS averages disagree with each other, because each vendor measures its own customer base with its own methods. Treat every figure below as one dataset’s view.
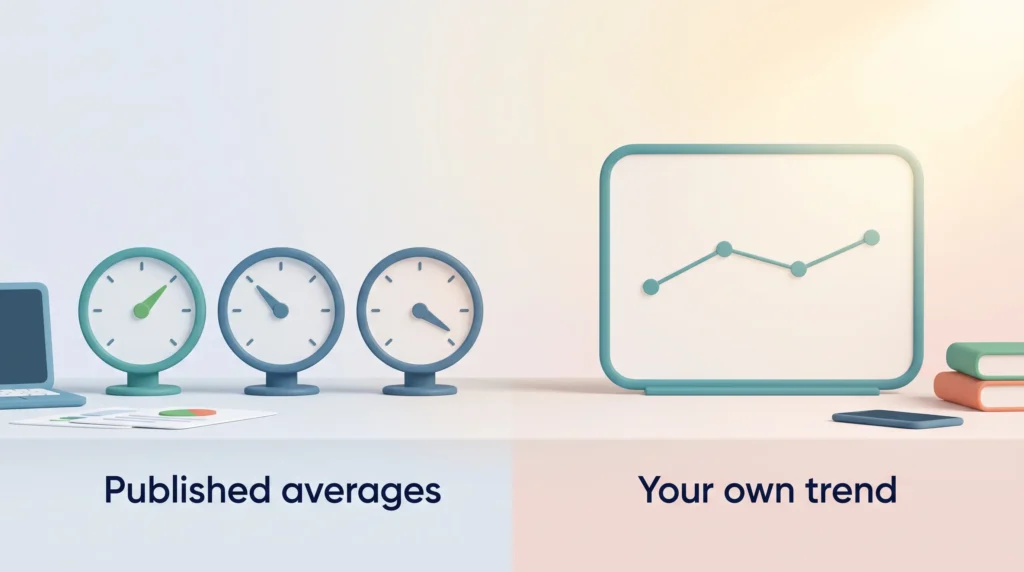
Recent benchmarks across sectors
SurveyMonkey, citing Hive HR research, reported an overall eNPS benchmark of 27 for Q3 2024. Its sector figures show wide variation: Hospitality 30, Technology 28, Health 15, Manufacturing 15, Nonprofit 10, Entertainment and Recreation 5, Education 0, Retail -5, and Government -15.
Other datasets land lower. A January 2026 benchmark compilation published by eNPS Tools (feedbackpulse.com), covering about 5,000 organizations, puts the median eNPS at +17, with the United States at +17 and Germany at -6. Perceptyx, which tracks a global database of more than 20 million employees, reports a global average around 14. A QuestionPro study of 5,000 US full-time employees from December 2024 to January 2025 found an average of 32.
The spread between 14 and 32 for an “average” score is the real lesson. If your company sits at 20, one benchmark says you are above average and another says you are behind. Your own movement from one quarter to the next is far more reliable.
How organization size influences eNPS
Smaller companies usually score higher. SurveyMonkey’s data puts companies with up to 250 employees at an average eNPS of 30, and the 2026 compilation puts companies with up to 100 employees at +26. Proximity to leadership, faster decisions, and a tighter culture help.
Very large companies sit lower. SurveyMonkey reports an average of 9 for companies with more than 5,000 employees, and the 2026 compilation reports +11 for the same size band. Scale, bureaucracy, and uneven experiences across locations pull the aggregate down. Where hybrid and remote staff are involved, the remote employee engagement evidence adds useful context, because work arrangement affects scores too.
When and how to use benchmarks responsibly
Benchmarks are best for setting directional goals, not rigid targets. Compare by sector, size, and role to find relevant peers.
Tip: Track score changes alongside internal events (reorganizations, pay cycles, policy shifts) to explain movement.
Designing an effective eNPS survey with open-ended questions
Short, well-chosen follow-ups reveal why people gave the score they did. Start with the core rating and add one or two targeted prompts. Keep the form tight so each eNPS survey takes one to three minutes to finish.
Follow-up prompts that surface actionable insights
Use concise prompts such as: “What is the primary reason for your score?” and “What is one thing we could improve?” These open-ended questions let respondents add context without writing an essay.
Group the comments into themes such as communication, workload, and growth to find patterns quickly. Summarize the common threads and pair them with representative quotes when you report results. Modern AI-powered engagement surveys can do the first pass of this theme grouping automatically, which saves hours when hundreds of comments come in.
Balancing brevity with depth to avoid survey fatigue
Offer optional comment boxes rather than mandatory fields. That preserves depth for people with strong views while keeping friction low for everyone else.
- Standardize wording to keep data comparable across cycles.
- Tailor prompts for new hires, managers, or frontline teams for sharper insight.
- State how anonymity works and how feedback will be used, so people trust the process.
“Capture the score, then ask one clear why-question. Action follows clarity.”
Employee NPS in practice: cadence, timing, and real-time tracking
Cadence shapes the clarity of your feedback. Survey too often and you risk fatigue. Survey too rarely and you miss trends. Many HR teams run eNPS surveys quarterly or twice a year. Growing organizations often pulse more frequently during periods of change.
Quarterly vs biannual vs milestone-triggered pulses
Quarterly checks give fresher signals for managers and build a steady rhythm. Biannual surveys reduce the burden and suit stable periods.
Milestone-triggered surveys work well after reorganizations, policy updates, or leadership changes. A pulse 90 days after a new hire starts, for example, tells you whether your onboarding program is landing while there is still time to fix it.
Capturing timely sentiment during change
Stagger sends across teams to lower the simultaneous load. Align survey windows with planning cycles, and set deadlines for analysis and for communicating next steps so results do not sit in a dashboard for weeks.
Segmenting and analyzing your results for clarity
Divide the feedback into meaningful groups to reveal patterns that a company-wide score hides.
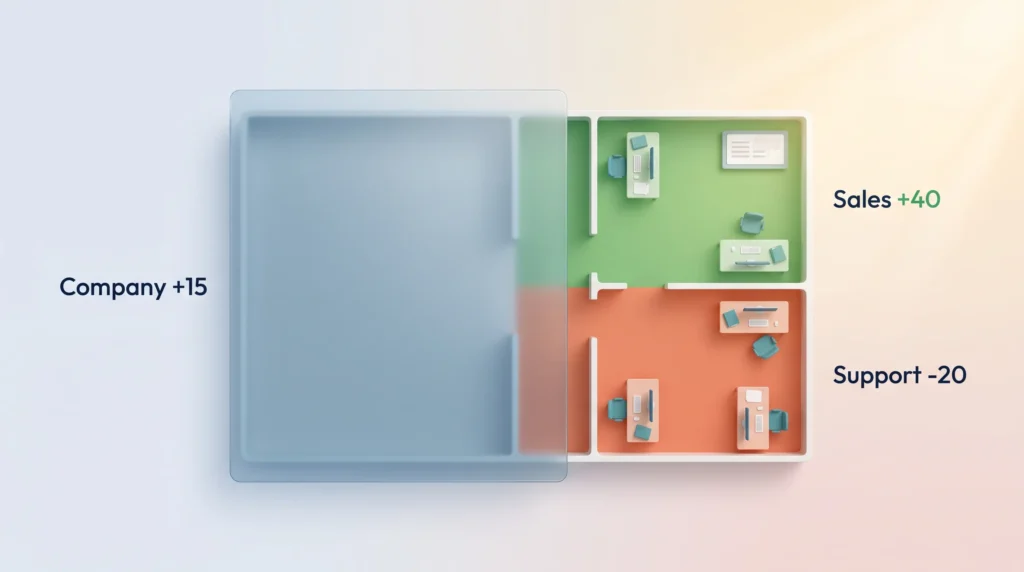
Slicing by team, tenure, location, and role
Break results down by team, tenure, location, and role so you can spot bright spots and pain points quickly. A company score of +15 can hide a sales team at +40 and a support team at -20.
Map comment themes back to each segment to see whether issues are local or span the whole organization.
Protect anonymity by enforcing minimum group sizes before you publish segment-level results. Many teams use five responses as the floor. Employee data is also regulated data, so check what the 2026 rules on employee data privacy require before you store or share responses.
Spotting trends and themes in qualitative feedback
Group comments into a simple set of categories (communication, leadership, workload, growth) to speed up analysis.
Track cohort trends over time to test whether your interventions deliver real improvement. If you have workforce analytics tools in place, correlate scores with outcomes like attrition and absenteeism to prioritize the areas that cost you most.
From insight to impact: turning eNPS feedback into action
Numbers tell a story. Your next step is to translate that story into a focused plan with clear owners and deadlines.
Co-creating action plans with managers and teams
After you analyze trends and segment results, invite managers and their teams to workshop solutions. Co-create a short list of improvements that are realistic and measurable. This is participatory management in its simplest form: the people closest to the problem help pick the fix.
Define owners, timelines, and success measures so each task has accountability. Small, sprint-style actions often win trust faster than large, vague programs.
Closing the loop to build trust and participation
Communicate what you heard, what you will do, and when employees can expect updates. Share both quick wins and a roadmap for longer initiatives. Regular one-on-one meetings are a natural place for managers to follow up on team-level themes.
“Close the loop: when people see feedback turn into action, participation and engagement grow.”
Levers that move your eNPS: matching fixes to comment themes
Let the themes in your open comments decide which lever you pull first. If detractors mention unclear priorities, start with leadership communication. If they mention stalled careers, start with growth. The four levers below match typical comment themes. For the full strategy playbook beyond this one metric, see our overview of what drives employee engagement today.
Culture and leadership: communication, trust, and transparency
Improve leadership communication with weekly updates and clear priorities. Make transparency a habit and share both progress and setbacks. A transparency culture gives employees fewer reasons to guess and more reasons to trust.
Result: stronger culture and better two-way trust across the company.
Career growth, learning, and development
Create clear career paths, mentorships, and short learning sprints. Offer practical skill courses tied to development goals. A career lattice that values sideways moves gives people options even when there is no promotion open.
This boosts job satisfaction and long-term loyalty.
Recognition, rewards, and work-life balance
Design recognition programs that highlight small wins and public shout-outs. The evidence on positive reinforcement at work explains how reward timing changes motivation and where recognition programs backfire. If workload shows up in your detractor comments, flexible schedules and workload checks help reduce employee burnout.
These moves lift satisfaction and turn quiet supporters into visible promoters.
Compensation and benefits as retention levers
Review pay and benefits every year to stay competitive and fair. Pair financial reviews with perks that support wellbeing. For a broader view of what keeps people, see these talent retention strategies.
“Use feedback to refine what matters most and link each initiative to measurable retention and engagement goals.”
Boosting eNPS response rates without burnout
Participation rises when invites match how your teams prefer to communicate. Personalize subject lines and preview text so messages feel human and relevant.
Pick the channels your employees actually use: email, SMS, workplace apps, or QR codes on kiosks for frontline staff. Keep the eNPS survey short: the core rating plus one or two follow-ups.
Automate sends after milestones like onboarding, promotions, or launches. That way the timing captures honest, timely feedback without extra work for HR.
Ensuring anonymity and clearly stating purpose
Be explicit about anonymity and how results will be handled. That builds trust and reduces the fear of speaking up on sensitive topics.
Explain why you are asking and how insights will lead to real improvement. Promise follow-up, then show results and actions so future participation rises. Companies that build a strong remote company culture tend to find this loop easier, because written, transparent communication is already the norm.
Limitations of eNPS and how to complement it
Numbers give you a quick signal, but they rarely explain why scores move. A single score can mask very different reasons for similar ratings. Two people may both answer 4, one because of workload and the other because of an unclear manager.
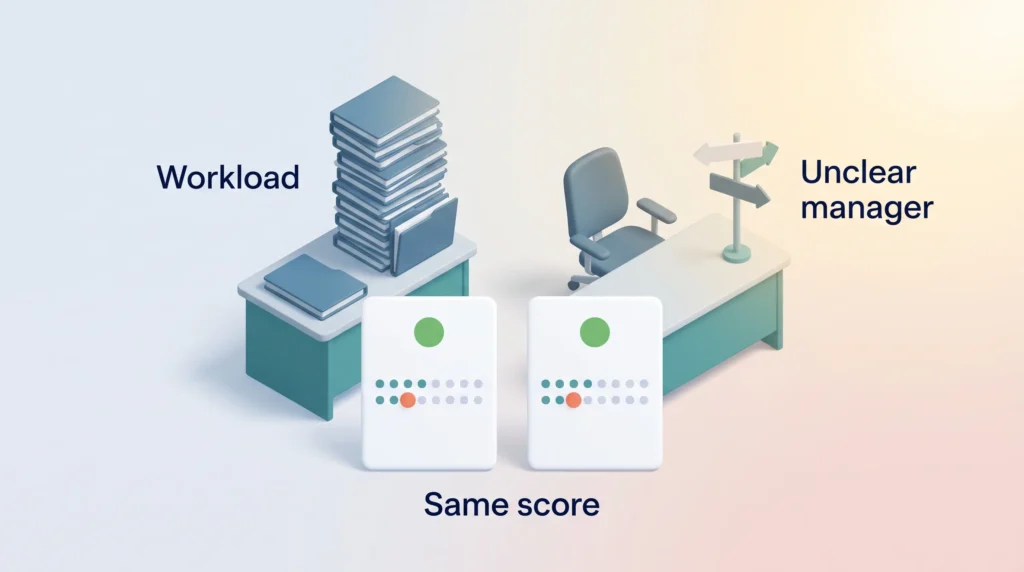
Why a single number needs qualitative context
Use the score as a starting point, not the full story. Short metrics show direction, while comments reveal root causes and practical areas for improvement.
There is also a measurement caveat. The 0-10 scale is subjective, cultural norms shape how people use it, and response rates influence the result. A score built on 30% participation says as much about the 70% who stayed silent as about those who answered.
Pairing eNPS with pulse surveys and interviews
Combine regular eNPS surveys with quick pulse surveys to track near-term shifts. Add interviews or focus groups to probe surprising trends. If your company already runs continuous performance management, eNPS fits naturally alongside those regular check-ins.
- Open-ended questions give the “why” behind a rating and guide actions.
- Pulse surveys catch changes between formal cycles and keep leaders informed.
- Interviews and focus groups uncover specific drivers tied to retention and culture.
Balance matters: avoid chasing a numeric target at the cost of real change. Use mixed methods to link feedback to concrete steps across teams and the wider company.
“Treat the score as an alert. Use qualitative data to design solutions that improve satisfaction, engagement, and retention.”
Tools and dashboards to run and scale eNPS programs
Choose platforms that turn scattered feedback into clear, actionable dashboards. Good tools give you templates, automated schedules, and secure segmentation so setup is fast and repeatable.
Survey platforms should support consistent question wording, role-based access, and privacy thresholds. That protects anonymity while letting managers see meaningful trends. For a small team, a general survey tool such as SurveyMonkey is often enough. Larger companies usually move to a dedicated employee experience platform that combines eNPS with pulse surveys, onboarding checks, and exit feedback.
Survey platforms, analytics, and reporting best practices
Build dashboards that show response rates, score trends, and hot spots by team. Integrate the open comments so qualitative context travels with each numeric result.
Operationalizing eNPS with real-time insights
Use alerts and tags to route urgent feedback to owners quickly. Link dashboard views to improvement plans and track progress visibly so teams see change.
For background on how feedback fits wider people practices, see the future of performance reviews and the current HR management trends.
Conclusion
A concise score, paired with comments, becomes a practical roadmap for change. Use the employee net promoter rating as a fast pulse, then add context to turn signals into solutions.
Keep reports segmented and timely so managers can act. Combine the net promoter number with short follow-ups to surface themes, track trends, and share clear results that lift engagement and satisfaction.
Make small experiments, measure the impact, and repeat. When you close the loop, employees see progress and trust grows. Over time, your company gains stronger loyalty, real improvement in daily work, and a healthier workplace.
Found this useful?
Make SmartKeys a preferred source on Google, and our articles will surface more often in your Top Stories, AI Overviews, and AI Mode.
Add as Preferred Source