Productivity is having a good run, and the question for 2026 is whether it lasts. Productivity, in the economist’s sense, means how much a worker produces per hour. The Bureau of Labor Statistics (BLS) reported on 3 September 2026 that output per hour in the nonfarm business sector rose 2.2% over the year to the second quarter of 2026.
Whether that is the start of a new era is still open. In May 2026, economists at the Federal Reserve Bank of San Francisco put the odds of a lasting high-growth phase at 57% by one measure, but at only 21% by a stricter one. This guide explains what that gap means for a team leader, freelancer or business owner.
In this guide, you get a plain-English view of where productivity stands, what AI and remote work actually do to output, and which tools and techniques are worth your time in 2026.
Key Takeaways
- US output per hour rose 2.2% over the year to mid-2026, and 2.1% a year on average since late 2019 (BLS).
- Economists see a 57% chance of a new high-growth era by one measure, but only 21% by a stricter one. Plan for both.
- The pandemic-era productivity spike was mostly temporary. Set targets on multi-year averages, not one quarter.
- About 39% of US workers used AI for work in a given week by mid-2026, but it saves only about 2% of total hours so far.
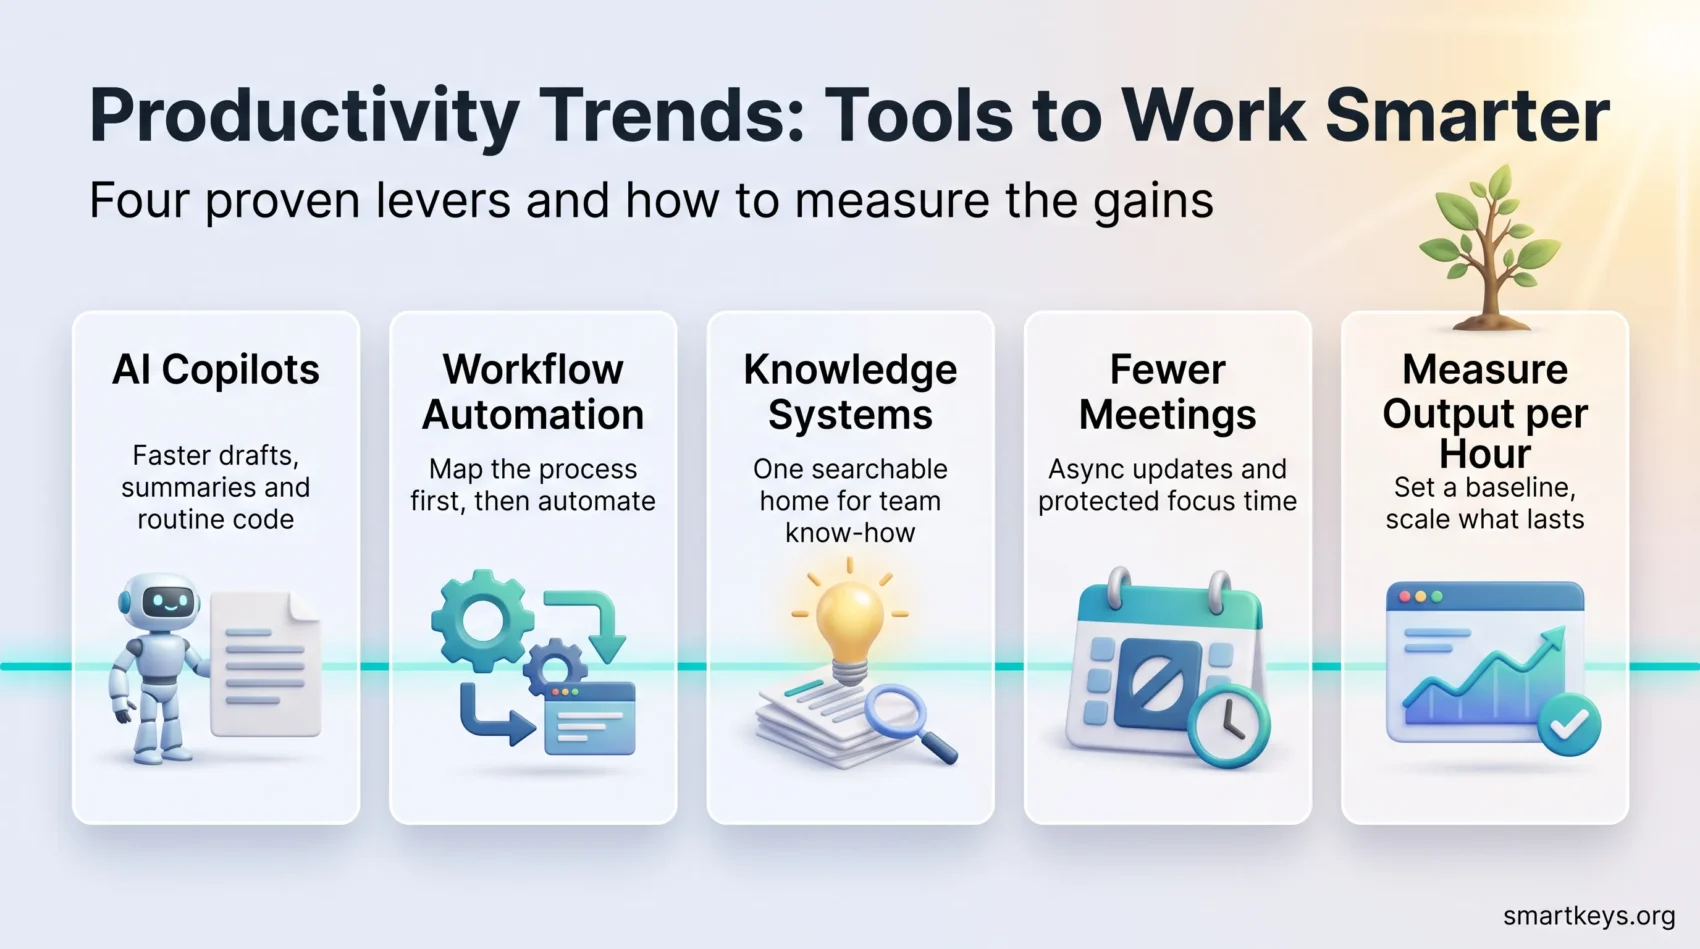
- The tools that pay off in 2026 are AI copilots, workflow automation, shared knowledge systems and fewer meetings. Each needs a process change to work.
Why Productivity Trends Matter for Your Business
Productivity decides whether wages, prices and profits can all rise at once. If a company produces more per hour, it can pay more without raising prices. If a whole economy does it, living standards climb.
The official measure is labor productivity: real output divided by hours worked. The BLS combines output data from the Bureau of Economic Analysis (BEA) with its own hours data to calculate it every quarter.
Two measures you will keep seeing
Output per hour rises when people get better tools, even if they work the same way. Economists call that capital deepening: more equipment, software or computing power per worker.
Total factor productivity (TFP) is stricter. It measures the output you get after accounting for both labor and capital. TFP only rises when the economy gets smarter about combining its inputs, not when it simply buys more of them. That distinction matters in 2026, because heavy AI investment is pushing up the first measure faster than the second.
Where US Productivity Stands in 2026
The latest BLS release (Productivity and Costs, second quarter 2026, revised) gives the current picture. Nonfarm business productivity rose at a 1.4% annual rate in the quarter. Output grew 1.7% while hours worked grew only 0.3%. Compared with a year earlier, productivity is up 2.2%.
Over the current business cycle, which the BLS dates from the fourth quarter of 2019, productivity has grown 2.1% a year. That is well above the roughly 1.3% pace of the decade before the pandemic.
One number in the same release deserves attention. Real hourly compensation fell 3.3% in the quarter, and the labor share of output dropped to 52.8%, the lowest reading in a series that goes back to 1947. Productivity is rising, but in early 2026 workers were not capturing much of the gain. Higher output per hour helps employees only when pay follows.
One caveat: quarterly figures get revised, sometimes by a lot. Quote the year-over-year rate instead.
Are We Entering a High-Growth Productivity Era?
Economists use a model that lets growth switch between a slow state and a fast state, then asks which state fits the data. The Federal Reserve Bank of Cleveland applied this approach in January 2025. It found two long-run trends: about 1.3% a year in the slow regime and about 3.0% in the fast one. With data through late 2024, the model gave a roughly 40% probability that the economy had shifted to the fast regime.
The San Francisco Fed updated the exercise in May 2026 with data through the end of 2025. Measured by labor productivity, the probability of a high-growth regime had risen to 57%. Measured by TFP, it was only 21%.
Why the two numbers disagree
The authors, Hamza Abdelrahman and Andrew Foerster, explain the gap with capital deepening. Businesses have poured money into AI systems and data centers. That gives workers more capital per hour and lifts output per hour. But TFP, which strips out the effect of simply having more capital, has grown only modestly. In their words, the investment has coincided with more productive workers but has not yet produced the broader gains that TFP is designed to measure.
They draw a parallel with the 1990s, when labor productivity also pulled ahead of TFP before the broad gains from computers and the internet arrived. That is why they call their view cautious optimism rather than a verdict.
How to read the signal
Regime shifts are usually confirmed only in hindsight. The 1973 slowdown, the 1997 acceleration and the 2005 slowdown were each recognized about two years after they began. So treat the 2026 reading as an input for planning, not a certainty.
A practical approach is to build two scenarios, one around 1.3% and one around 3.0% trend growth, and stage your investments so you can accelerate if the faster path holds. For guidance on adapting roles as automation spreads, see job automation adaptation, and for the broader evidence on AI and automation at work.
Pandemic Boom and Bust: Cyclical Surges vs Trend Growth
Measured output per hour jumped in 2020, fell back in 2021 and 2022, and then settled slightly above its pre-pandemic trend. Most of the spike was not real improvement. It was a change in who was working and how much.
Why output per hour rises when unemployment jumps
When layoffs hit, the least experienced and lowest-paid workers tend to lose their jobs first. The remaining workforce is more experienced on average, so output per hour rises even though the work has not changed. The reverse happens as hiring resumes.
Three temporary drivers of the 2020 spike
First, labor composition improved because fewer inexperienced workers were employed. Second, capital deepening rose because the same equipment served fewer workers. Third, work intensity spiked as businesses ran lean during the early recovery.
As hours and hiring normalized, all three effects faded. Activity shifted back toward services such as hospitality, where output per hour is lower. What persisted were modest gains at firms that invested in automation and better tools. The lesson: treat gains during a downturn as non-recurring when you set targets.
The Long View: Productivity Trends Since the 1970s
Across the postwar decades, US output per hour has alternated between fast and slow phases. The Cleveland Fed model dates the main breaks to early 1973 (into the slow regime), early 1997 (into the fast regime, during the IT boom) and early 2005 (back to slow). Those dates anchor any long-run comparison.
The slowdown after 2005 was not a US story alone. Trend growth drifted down across advanced economies, more steeply in much of Europe. Economists attribute most of it to shared forces: aging populations, slower spread of new technology and lower investment. The United States sits above most peers but still below its late-1990s pace.
Data revisions can move the story. Official statistics struggle to count software, data and other intangible assets, so gains from digital tools often show up late. The BEA’s comprehensive updates in 2024 raised measured output since 2019 and lifted estimated productivity growth by about 0.21 percentage points a year. Expect more revisions as agencies work out how to count AI-related investment, and track your own software-enabled gains alongside the official data. Our overview of future work trends to 2030 puts these figures in a wider context.
For your planning, use multi-year averages and align hiring and capital spending with scenario ranges rather than single readings.
AI, Remote Work and New Technologies: What Actually Moves the Needle?
Technology helps, but measurable gains come when you match tools to clear workflows. The 2026 evidence shows how wide the gap between adoption and results still is.
Generative AI: fast adoption, modest measured gains so far
Adoption is real. A quarterly tracker by economists Alexander Bick, Adam Blandin and David Deming, reported by the St. Louis Fed in August 2026, found that 39.2% of employed adults used generative AI for work in a given week by the second quarter of 2026, up from 28.2% in late 2024. AI assisted 6.3% of all work hours. Workers reported that it saved about 2.2% of their total hours.
At the company level, adoption is narrower. The Census Bureau’s Business Trends and Outlook Survey found that 17% to 20% of US businesses used AI to produce goods or services in spring 2026. Among firms with 250 or more employees the share was 37%. Small firms with fewer than 20 employees showed little change over the previous six months.
The economic ceiling is also lower than the hype suggests. MIT economist Daron Acemoglu estimated in 2024 that generative AI would add no more than about 0.5% to 0.7% to TFP over ten years, given the share of tasks it can realistically take over. That is a useful boost, not a regime change on its own. Our guide to AI in business operations looks at why many AI projects still show no return.
Remote work: no measurable effect on the trend
Economists at the San Francisco Fed compared 43 industries in January 2024. Industries where more jobs can be done remotely did grow faster during the pandemic, but they had also grown faster before it. Once that prior trend is removed, the relationship disappears. Remote work changed where people work, not how much they produce per hour, at least in the aggregate. For what does move the needle at home, see our guide to remote work productivity.
Capital deepening and automation: the proven pathways
The gains in the data so far come from investment: better tools per worker. So focus on proven levers such as automating rule-based work and redesigning workflows. Start narrow, measure, and scale only where results persist.
- Tip: prioritize high-frequency tasks that already have written procedures. Our guide to standard operating procedures shows how to write them.
- Tip: invest in training so tools turn into measurable output. See upskilling and reskilling in 2026.
- Tip: align spending with processes built for continuous improvement.
Top New Productivity Tools and Techniques You Can Use in 2026
The national data shows where the gains come from: better tools per worker, applied to repeatable work. Here is how to translate that into practice for a team of any size.
AI copilots for research, summaries and code
AI copilots are assistants built into the software you already use, such as your email client, office suite or code editor. They cut time on first drafts, meeting summaries, data lookups and routine coding. Aim them at the tasks where your team spends the most repetitive time, standardize prompts, and set rules for confidential data before rollout. Our guide to AI-powered assistants at work covers what works and what the EU AI Act now requires.
Workflow automation with no-code and low-code tools
Workflow automation means letting software move data between systems and trigger the next step without a person copying and pasting. No-code and low-code tools let non-programmers build these flows. Map the process first, then automate, because automating a broken process only produces mistakes faster. Start with daily handoffs: new leads, invoices, support tickets, onboarding checklists. See our guides to low-code business process automation and hyperautomation.
Knowledge systems and retrieval
Teams lose hours every week hunting for the right document or the person who knows. A central knowledge base with search that understands plain questions fixes most of that, and the 2026 generation of these tools can answer questions from your own documents. Our article on knowledge management 2.0 explains how to set one up.
Meeting and time compression
Replace status meetings with written async updates, agree on team-wide focus hours with no meetings, and protect blocks for deep work. See our guides to effective meetings and working smarter for concrete formats.
“Stage deployments to deliver quick wins this year while building the foundations for compounding gains.”
Measuring Your Gains: Metrics, Benchmarks and Data Discipline
Before you change workflows, agree on how you will measure gains and what counts as a durable improvement.
From vanity to value: output per hour and simple TFP proxies
Make output per hour worked your north-star metric. Define output in units that matter for your business: tickets resolved, orders shipped, proposals sent. Record a baseline before the change.
When full accounting is impractical, use a simple proxy for TFP: output per dollar of tools and equipment. If output per hour rises only because you bought more software, that is capital deepening. If it rises with the same tools, you have found a real process gain.
Instrumenting workflows: cohorts and revision-aware KPIs
Compare cohorts: a team using the new tool against a similar team that is not. Review the numbers quarterly and tie incentives to gains that last more than one cycle.
A productivity dashboard makes this visible, and workforce analytics tools help larger teams do it at scale. One warning: measure output, not activity. Tracking keystrokes and online hours breeds the productivity paranoia that quietly destroys trust.
“Anchor internal metrics to external series and institutionalize reviews to separate durable trend improvements from one-off spikes.”
Conclusion
The 2026 data show real momentum. US output per hour is up 2.2% on the year and has grown 2.1% a year since late 2019. By the labor productivity measure, the odds of a lasting high-growth era are now 57%. By the stricter TFP measure, they are 21%. The honest reading is cautious optimism: better tools are making workers more productive, and the broader gains that would confirm a new era have not arrived yet.
Focus on what you control: allocate capital carefully, redesign core processes before automating them, and train your people. Measure against output per hour, stage your investments, and revisit the plan as each quarterly release arrives. Our overview of the future of business analytics shows how to build that data discipline, and our guide to future job skills covers what your team needs to learn next.
Found this useful?
Make SmartKeys a preferred source on Google, and our articles will surface more often in your Top Stories, AI Overviews, and AI Mode.
Add as Preferred SourceFAQ
What does “output per hour worked” mean and why should you care?
Output per hour worked measures the goods and services produced for each hour someone works. It is the standard definition of labor productivity and the figure the Bureau of Labor Statistics reports every quarter. It matters because it links directly to living standards and wage growth: a company that produces more per hour can raise pay without raising prices. For your own team, it is also the cleanest way to check whether a new tool or process is delivering, because it holds hours constant and looks only at results.
Where does US productivity stand in 2026?
According to the revised second-quarter 2026 release from the Bureau of Labor Statistics, published on 3 September 2026, nonfarm business productivity grew at a 1.4% annual rate in the quarter and 2.2% compared with a year earlier. Over the current business cycle, which began in the fourth quarter of 2019, it has grown 2.1% a year. That is well above the roughly 1.3% pace of the decade before the pandemic but short of the late-1990s pace. Quarterly numbers are revised often, so the year-over-year rate is the more reliable guide.
Are we entering a sustained high-growth productivity era?
The evidence is encouraging but not conclusive. In May 2026, economists at the Federal Reserve Bank of San Francisco estimated a 57% probability that the US is in a high-growth regime when measured by labor productivity, up from about 40% in a Cleveland Fed analysis from January 2025. Measured by total factor productivity, which strips out the effect of simply having more capital per worker, the probability was only 21%. Such shifts were historically confirmed only about two years after they began, so treat the signal as a reason for staged investment rather than certainty.
What is the difference between labor productivity and total factor productivity?
Labor productivity is output per hour worked. It rises whenever workers get more or better tools, even if they work the same way. Total factor productivity (TFP) measures the output you get after accounting for both labor and capital, so it only rises when the economy combines its inputs more cleverly. The distinction matters in 2026 because businesses have invested heavily in AI systems and data centers. That lifts labor productivity through capital deepening, but TFP has grown only modestly.
How did the pandemic affect these measures, and was the boom real?
Mostly not. Measured output per hour jumped in 2020 because layoffs removed the least experienced workers, the same equipment served fewer people, and businesses ran lean during the early recovery. As hiring resumed and activity shifted back toward lower-productivity services such as hospitality, those effects reversed. What remained was a modest gain above the pre-pandemic trend, concentrated in firms that invested in automation and better tools. Treat gains during a downturn as non-recurring and set targets on multi-year averages.
What realistic impact are generative AI and remote work having on productivity?
Generative AI is spreading quickly but its measured effect is still modest. A quarterly tracker reported by the St. Louis Fed in August 2026 found that 39.2% of employed adults used generative AI for work in a given week by the second quarter of 2026. AI assisted 6.3% of work hours and saved about 2.2% of total hours. At the company level, only 17% to 20% of US businesses reported using AI in production in spring 2026, according to the Census Bureau. Remote work shows no measurable effect on the trend: San Francisco Fed research found no relationship between an industry’s share of remote-capable jobs and its productivity growth once pre-pandemic trends are accounted for.
Which tools and techniques should you try in 2026, and how do you know they work?
Start with four levers: AI copilots for drafting, summaries and code; no-code workflow automation for daily handoffs such as leads, invoices and tickets; a central knowledge base with plain-language search; and meeting compression through async updates and protected focus hours. To know whether they work, define output in units that matter for your business, record a baseline before the change, and compare a team using the new tool with a similar team that is not. Track output per hour rather than activity, and scale only where the gain persists for more than one cycle.