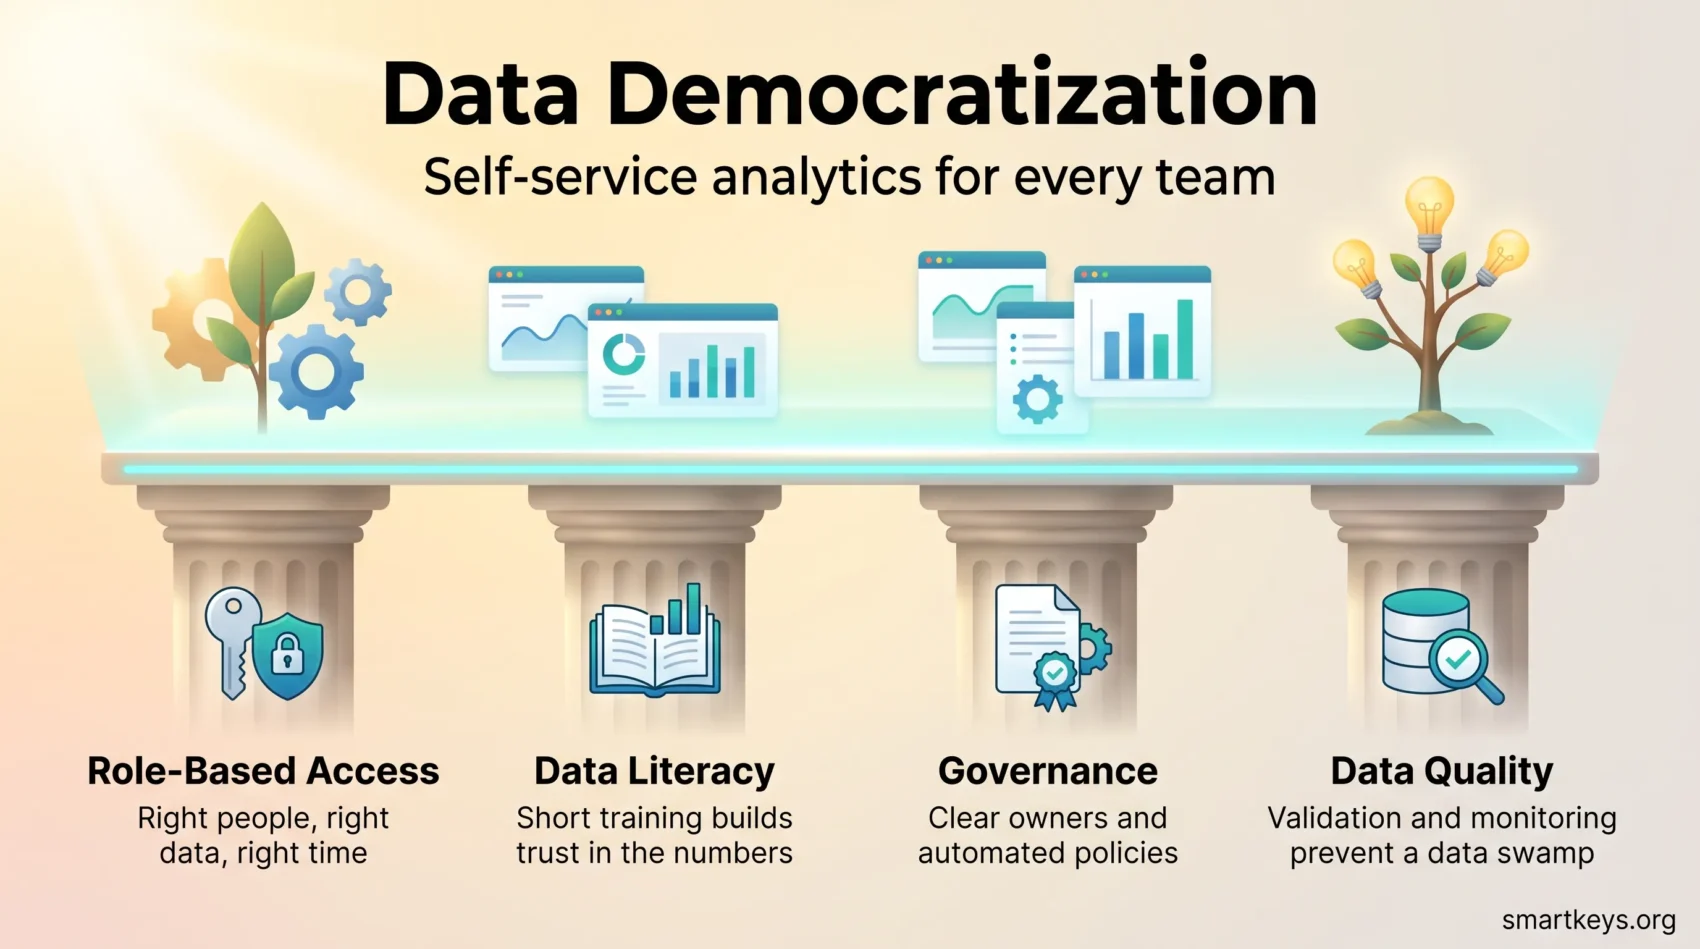
Data democratization means giving your teams the access, tools, and training they need to answer their own questions with company data, without waiting for IT. A marketing manager checks last week’s campaign numbers herself. A support lead sees which product issues drive the most tickets. Decisions happen the same day instead of next week.
This is both a technical and a cultural shift. Technically, a central and well-governed data platform removes the silos that lock information inside one department. Culturally, people need enough skill and trust to use what they find. Governance (the rules for who may see what, and who keeps data correct) and data literacy (the ability to read and question data) matter from day one.
This guide explains what data democratization is, why it matters in 2026, which building blocks it needs, and how to roll it out step by step.
Key Takeaways
- Data democratization pairs safe, role-based access with training so non-technical teams can act on data themselves.
- Balance central guardrails with local exploration; too much control creates ticket queues, too little creates shadow spreadsheets.
- Four pillars carry the program: access, data literacy, governance, and data quality.
- Data fabric, data mesh, and lakehouse are architecture patterns, not products; most companies combine them.
- Gartner lists poor data literacy among the top five roadblocks to data and analytics success, so training is not optional.
- Start with an audit and a small pilot, measure time-to-insight, and scale only what works.
Why data democratization matters right now
Waiting on IT for every report costs time and opportunities. In many companies, one central team still owns every dashboard and every database query. Requests pile up. By the time an answer arrives, the decision has already been made on gut feeling.
Two things changed by 2026. AI assistants now sit inside most analytics tools, which lowers the barrier for asking questions in plain language. And expectations rose with them: leaders expect every team, not just the analysts, to back decisions with numbers.
Secure, purpose-limited access removes the usual slowdowns: departmental silos, ad hoc permissions, and tool sprawl. With governance and training in place, teams can use data responsibly and move faster.
- Faster decisions: a product manager checks feature usage herself instead of waiting three days for a report.
- Less legacy drag: one trusted source replaces five slightly different spreadsheets.
- More experiments: trained employees test a pricing or campaign idea and see the result within a week.
- Lower risk: clear policies and automated checks keep sensitive fields protected while access grows.
Align business and analytics goals up front so access supports priority initiatives, not just exploration. An analytics maturity model gives you a simple scale to see where your setup stands today.
What data democratization is and what it is not
Safe, guided access reshapes how teams solve problems. This is more than open reports. It is a coordinated move to grant access, teach skills, and build trust so insights are useful and reliable.
Access, education, and trust
True democratization pairs appropriate access with training so people can read and reuse information correctly. It is not a free-for-all. Purpose-based permissions and governance decide who sees what and when. A sales rep sees pipeline data for her region; she does not see payroll.
From IT gatekeeping to self-service analytics
Move deliberately. Self-service analytics means business users explore and visualize data on their own, using sources that IT has prepared and certified. IT shifts from answering every request to maintaining quality, tooling, and guardrails.
- Teach and enable: short, role-specific training sessions for employees.
- Define boundaries: governance sets the policies; teams own the outcomes.
- Start small: pilot a few tools with one team, measure adoption, then scale across the organization.
The business case: benefits you can realize across teams
A unified view of the facts shortens approval loops and frees teams to focus on impact. When your company standardizes its sources, everyone sees the same numbers. That one change reduces errors and repeated work.
Break down silos and reduce bottlenecks
Centralizing and standardizing information stops teams from reconciling conflicting reports in every meeting. IT no longer handles every request, so technical staff can move to higher-value projects such as machine learning models and automation.
Improve productivity, collaboration, and revenue impact
Self-service access lets employees finish tasks faster and collaborate across teams. Marketing, sales, and product groups use shared insights to prioritize campaigns, target prospects, and shape products. Presenting those insights well matters too; data storytelling turns a chart into a decision.
Strengthen transparency and a shared data language
When stakeholders review one trusted source, accountability improves and meetings become more decisive. A shared glossary of metrics (what exactly counts as an “active customer”?) prevents two departments reporting different revenue figures for the same month.
“You’ll see lower operational costs, fewer ticket queues, and clearer ROI when teams work from the same playbook.”
For a wider view of how teams use data in daily work, see our guide to data-driven work.
The four pillars: access, data literacy, governance, and quality
Four pillars make self-service analytics safe, useful, and scalable. They keep systems reliable while letting employees act quickly.
Right people, right data, right time: role-based access
Define role-based access so users see only what their job requires. Apply least-privilege rules (each person gets the minimum access needed) and purpose limits to protect sensitive fields. A finance analyst needs invoice data; the marketing intern does not.
Data literacy training so non-technical users can trust and use data
Build short, role-specific training so employees find and interpret reports confidently. Gartner defines data literacy as the ability to read, write, and communicate data in context. Its 2024 survey of chief data and analytics officers listed poor data literacy among the top five roadblocks to success. Gartner also reports that 83 percent of those officers run a data literacy program or plan one within a year. Our guide to building a data literacy program walks through the steps.
Robust data governance to protect privacy, security, and compliance
Governance sets who owns which data, how standards are enforced, and what auditing looks like. Good governance aligns policies with business outcomes so rules feel enabling rather than blocking. A written data governance strategy is the place to define owners, definitions, and escalation paths.
Data quality management to avoid a data swamp
A data swamp is a data lake nobody trusts because nobody maintains it. Avoid it with profiling (checking what the data actually contains), validation rules, and monitoring. Add feedback loops so errors get fixed fast and trust grows.
Architectures that enable democratization: data fabric, data mesh, and lakehouse
The architecture you choose shapes how quickly teams can find and trust insights. Each pattern offers different trade-offs for governance, quality, and access. Most companies mix them.
Data fabric for unified access
Think of a fabric as a connectivity layer. It links data lakes, warehouses, databases, and legacy systems through services and APIs. Users get a single view of company data without needing to know where each piece physically lives.
Data mesh for domain ownership
A mesh treats datasets as products owned by the teams closest to them. Sales owns and documents sales data; logistics owns shipment data. Each domain publishes its data products with clear service levels. Shared standards keep governance consistent while domains stay autonomous.
Lakehouse for analytics and AI
A lakehouse combines the cheap, flexible storage of a data lake with the structure of a data warehouse. It reduces duplication and simplifies both reporting and model training. Use it for heavy analytics while fabric or mesh handle integration and ownership. Our article on data lakes for business intelligence covers the storage side.
“Combine fabric for integration, mesh for product thinking, and a lakehouse for scale.”
- Tip: map architectures to business capabilities to avoid fragmentation.
- Migration: modernize incrementally. Integrate systems first, then shift ownership, then consolidate analytics.
- Hosting: most companies run these patterns across cloud and on-premises systems; a clear hybrid cloud strategy keeps that manageable.
Your modern data stack for self-service analytics
Map the practical tools that let teams find and act on trusted information fast. Build a stack that pairs discovery, analysis, and governed access so employees spend time on insights, not plumbing.
Catalogs and business intelligence for discovery and insight
A data catalog is a searchable inventory of your datasets, with descriptions, owners, and quality ratings. Certification tags (“approved for finance reporting”) and usage notes help teams find the right resource quickly.
Business intelligence (BI) platforms then let analysts and non-technical users explore and visualize data without waiting on engineering. If you are comparing options, our overview of business intelligence tools and the head-to-head of Zoho Analytics vs Power BI are good starting points.
The semantic layer: one definition of every metric
A semantic layer sits between raw tables and the dashboards people see. It defines business terms once (“net revenue”, “active user”) so every tool and every AI assistant calculates them the same way. Gartner predicted in March 2026 that by 2030, universal semantic layers will be treated as critical infrastructure, alongside data platforms and cybersecurity. This layer stops ten teams from inventing ten versions of the same number.
Metadata, lineage, and virtualization
Metadata describes what a dataset is; lineage shows where the numbers came from and how they changed on the way. Together they build trust and simplify audits.
Virtualization and federation let you query across sources without copying everything into one place. This reduces duplication and keeps policy enforcement where the records live. When decisions depend on fresh numbers, real-time data pipelines add the final piece.
AI assistants inside the stack
Most BI tools now include natural-language querying and automated insights, a category known as augmented analytics. These features widen access, but they are only as good as the semantic layer and data quality beneath them. An assistant that confidently answers from a stale table is worse than no assistant.
- Trust builders: certification, comments, ratings, and usage stats speed adoption.
- Persona fit: tailor views for analysts, operators, and executives so each group can use data confidently.
Governance, security, and compliance without slowing teams down
You can secure sensitive information without adding drag to everyday workflows. Unified policies map rules to use cases so teams get access fast while you stay compliant.
Start with clear, enforceable standards. In the EU, GDPR sets the baseline for personal data. In the United States, 20 states have comprehensive consumer privacy laws in effect in 2026, according to the policy tracker MultiState. A privacy compliance framework maps these overlapping rules to one set of controls.
Embed access and purpose limits across platforms so only the right users see sensitive fields. That reduces manual tickets and speeds outcomes. Employee data deserves particular care; our guide to data privacy at work covers what employers owe their staff.
Governance for AI use of your data
Since 2 August 2026, the EU AI Act’s transparency obligations apply to companies that deploy AI systems. The stricter high-risk rules were pushed back to 2027 under the Digital Omnibus package. In practice, you need to know which datasets feed which AI tools and be able to explain it. Our articles on EU AI Act compliance and building an AI governance model go deeper.
Operationalize governance with automation
Automated classification, lineage capture, and policy enforcement scale governance without adding headcount. Machine learning can tag sensitive records, apply masking, and trigger approvals. Gartner’s March 2026 predictions go further. By 2030, half of organizations will use AI agents to turn governance policies into machine-verifiable data contracts. A data contract is an automated agreement about what a dataset must contain and how fresh it must be.
- Embed controls so governance travels with the data across environments.
- Give stakeholders dashboards that show who accessed what.
- Define escalation paths and approvals to keep audits clean and predictable.
“Strong controls don’t have to slow you down. Automation and clear standards keep teams moving quickly.”
Your step-by-step roadmap to democratize data
A practical roadmap begins with an audit that surfaces your true bottlenecks. Start small and map storage, platforms, access paths, literacy levels, and security gaps. This gives you a clear list of fixes and priorities.
Audit and goals
Perform a candid inventory. Check platforms, tools, permissions, training needs, and compliance posture. Then define goals tied to business outcomes, such as “cut the average wait for a sales report from four days to one”, so trade-offs are clear.
Framework, integration, and controls
Map where modernization, automation, and AI add value. Centralize or virtualize access to cut switching costs. Catalog assets with owners and definitions so teams find trusted sources fast. Watch for shadow IT: unofficial data copies show you where the official path is too slow.
Rollout, training, and continuous improvement
- Establish governance and automate enforcement early.
- Offer role-based training and ongoing literacy coaching.
- Choose interoperable tools that match how teams work.
- Allocate change-management resources and name champions in each department.
- Measure adoption, time-to-insight, quality, and compliance; then iterate.
This is as much a people project as a technology project. A structured change management strategy keeps momentum after the pilot ends.
“Start with clear goals and short pilots. Measure constantly and scale what works.”
Overcoming common challenges and risks
Tackling common hurdles early keeps your program from stalling and builds trust fast.
Low literacy and hard-to-use tools are the top blockers. Fix literacy gaps with short, role-based training and mentoring. Fix usability with role-based interfaces so employees can contribute without heavy training. Both shrink support queues and lift adoption.
Prevent misuse and protect sensitive information
A governance-first design reduces misuse by default. Embed controls where users access information so policies travel with the record.
Address security head-on: define least-privilege access, monitor activity, and test controls regularly. Make compliance visible and routine so approvals are faster and less risky.
Avoid the opposite failure: too much freedom
Open access without shared metric definitions produces the “which number is right?” meeting. When every team builds its own dashboard from raw tables, you have democratized confusion, not data. The semantic layer and the catalog are the cure. Clear decision-making models also help teams agree in advance which numbers a decision rests on.
Powering AI initiatives with democratized, AI-ready data
When teams can access validated inputs with clear lineage, AI moves from experiment to production faster. Democratization strengthens model training by improving dataset quality and trust. That creates more reliable results and repeatable outcomes.
Better datasets, visible lineage, and MLOps
Use rigorous pipelines. MLOps (the practices for building, deploying, and monitoring machine learning models in a repeatable way) makes model work auditable. Visible lineage shows how information changed before training. If your company runs large language models, an LLM Ops strategy extends the same discipline to those systems.
Choosing use cases and scaling responsibly
Less time on access tickets means your specialists can prioritize automation and product experiments. Pick projects where data quality, availability, and business value intersect. Add bias checks, policy-aware pipelines, and human oversight so scaling stays compliant and secure.
Real-world momentum: what modernization delivers
Platform modernization turns slow pipelines into real-time business levers. Vendors and consultancies publish many case studies of companies moving from older Hadoop clusters to a lakehouse. The reported gains follow a consistent pattern: lower engineering and infrastructure costs, and data that arrives in minutes rather than the next morning. Treat specific percentages in such case studies with care; they are written by the vendor selling the platform.
Faster delivery feeds BI tools and applications, giving marketing, product, and operations shared insights. When employees trust the system, adoption rises and teams spend time on outcomes instead of reconciling reports. For where all of this is heading, see our piece on the future of business analytics.
Conclusion
Make the roadmap real by focusing on quick wins that prove value and win trust. Balance matters: combine central guardrails with local access so employees can use data confidently. Invest in catalogs, BI, a semantic layer, lineage, and training to keep quality high and adoption steady.
Start with an audit, pick measurable pilots, and scale what works. When you align resources, tools, and literacy, your organization unlocks the benefits of data democratization: more innovation, faster decisions, and better outcomes.
Found this useful?
Make SmartKeys a preferred source on Google, and our articles will surface more often in your Top Stories, AI Overviews, and AI Mode.
Add as Preferred Source