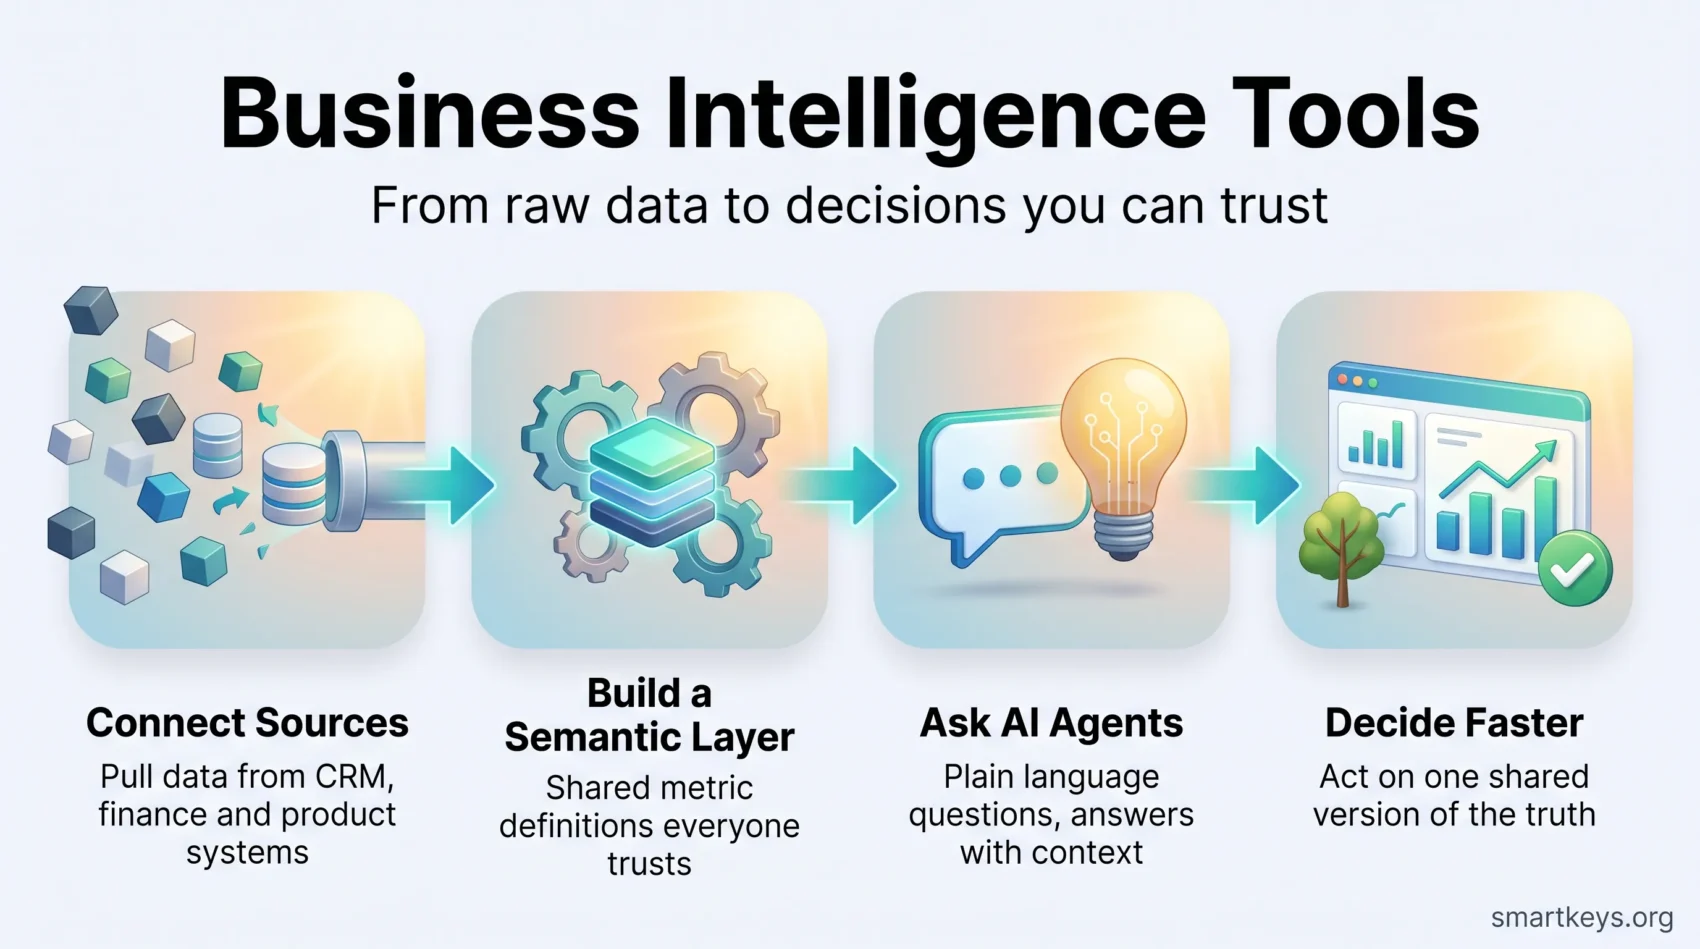
In today’s data-driven business world, Business Intelligence Tools turn raw operational data into answers people can act on. The category has changed more between 2024 and 2026 than in the decade before it. The dashboard is no longer the main interface, and the analyst is no longer the only person who can ask a question.
The market reflects that shift. Grand View Research valued the global business intelligence software market at $40.1 billion in 2025 and projects $43.7 billion in 2026, reaching $81.5 billion by 2033 at a compound annual growth rate of 9.3%. Much of the current vendor investment is going into agentic AI: systems that plan an analysis, fetch the right data, and explain the result in plain language instead of waiting for someone to build a report by hand.
This guide covers what BI software actually does, how the pieces fit together, what genuinely changed in 2026, and how to pick the best BI software for your team before you sign a contract. For the strategic view beyond tool selection, see our overview of where business analytics is heading.
Key Takeaways
- The global BI software market is projected at $43.7 billion in 2026, on the way to $81.5 billion by 2033 (Grand View Research).
- Conversational and agentic features are the main competitive battleground among BI vendors in 2026.
- Only about 17% of organizations have deployed AI agents so far, while more than 60% expect to within two years (Gartner, 2026).
- A governed semantic layer matters more than the chart library: it is what keeps natural-language answers correct.
- BI tools explain what happened and why; business analytics forecasts what is likely next. Most teams need both.
- Integration, data quality and adoption decide whether a BI project pays back, not the length of the feature list.
Introduction to Business Intelligence
Business Intelligence is the practice of collecting data from across a company, organizing it so the numbers can be compared, and presenting it so that someone can decide something. The technology matters less than that last step. A report nobody acts on is not intelligence.
Definition and Overview
Business intelligence covers the tools and methods used to describe what happened in a business and diagnose why. That spans data integration, storage, modeling, querying, visualization and distribution. Modern BI solutions bundle most of these into one platform, which is why the category is better understood as a stack than as a single product.
The practical goal is a shared version of the truth. When sales, finance and operations each keep their own spreadsheet, meetings turn into arguments about whose number is right. A governed BI layer settles that question before the meeting starts. Self-service analytics then lets teams answer their own follow-up questions without filing a ticket.
The Evolution of Business Intelligence
BI began as static, IT-produced reports delivered on a schedule. Self-service tools moved authorship to business teams. Cloud data lakes and warehouses removed the storage ceiling, and augmented analytics layered automated pattern detection on top of it.
The 2026 generation adds a conversational layer: you ask, the system answers. It does not replace the earlier layers. It sits on them, and it inherits every weakness in the data model underneath.

Understanding Business Intelligence Tools
Most companies end up running more than one type. Knowing which category solves which problem keeps you from buying a visualization tool when what you needed was a data model.
Types of Business Intelligence Tools
- Reporting tools: scheduled, structured output for recurring questions such as monthly close, compliance reporting or board packs.
- Dashboard software: a curated view of key performance indicators that a team checks regularly, built for monitoring rather than exploration.
- Data visualization tools: built to make relationships in a dataset visible, and to support data storytelling when a chart has to persuade rather than just inform.
- Self-service and ad hoc query tools: let business users slice data themselves against a governed model, which is where real-time data becomes genuinely useful.
- Embedded analytics: charts and metrics delivered inside another application, so people never leave the tool they already work in.
Key Features of Effective BI Software
- A semantic layer: shared definitions of revenue, churn, active customer and every other metric that matters. This is the single most important feature in 2026, because it is what AI features read from.
- Customizable reporting: output that fits how your business is structured rather than how the vendor’s demo dataset was structured.
- Advanced analytics: cohorting, segmentation, forecasting and anomaly detection without exporting to a separate tool.
- Real-time or near-real-time access: worth paying for only where a decision genuinely changes within the hour.
- Seamless integration: native connectors to your warehouse, CRM, finance system and product database.
- Granular access control: row-level and column-level permissions, plus an audit trail of who queried what.
Why Business Intelligence Tools Matter
Collecting data has become cheap. Acting on it has not. BI tools exist to close that distance.
Turning Data into Decisions
Most companies already hold more data than they use: transactions, support tickets, product events, marketing touchpoints, finance records. Each system answers its own narrow question well and says nothing about the others. BI tools join those sources so a single question, such as which customer segment is quietly becoming unprofitable, can actually be answered.
The output only matters if it reaches the decision. Teams that get results from BI treat distribution and habit as part of the project, not as an afterthought.
Supporting Strategic Decision Making
Better decisions come from having the right information at the moment the choice is made. BI tools let you look at historical performance and current conditions side by side, which is what turns a hunch into a defensible call.
It is also why analytics maturity predicts value better than spend: an organization that cannot agree on its metric definitions will not get better decisions from a more expensive dashboard.
That is also the practical test when you compare vendors: ask which of your recurring decisions the tool will make faster, and who will own the definitions behind it.
How Business Intelligence Tools Work
Understanding the BI lifecycle shows where a project is likely to break. Almost every failure traces back to one of these stages rather than to the visualization at the end.
The BI Lifecycle: From Data Collection to Reporting
The lifecycle starts with collection. Data is pulled from transactional systems, application event streams, third-party providers and, in some cases, customer data platforms. It then lands in a warehouse or lakehouse where it can be stored at scale and queried consistently.
Modeling comes next, and it is the stage teams most often underinvest in. Raw tables get cleaned, joined and shaped into a semantic model with agreed definitions. Only then does analysis produce something trustworthy, and only then is reporting worth automating.
Data governance runs across all of it: lineage, ownership, quality checks and retention rules. In 2026 that work has a second purpose, because AI features are only as reliable as the model they read.
Interactivity and Data Exploration
Modern data analytics tools are built for iteration. You start with a broad view, filter to a segment, notice something odd, and drill into the underlying records without writing a query. Each step narrows the question.
This matters because the first question is rarely the right one. Exploration is how a vague concern about declining margins becomes a specific finding about one product line in one region.
The 2026 Shift: AI Agents and Conversational BI
The biggest change in business intelligence right now is not a new chart type. It is who, or what, builds the chart for you.
Through 2025 and into 2026, major vendors moved from simple chatbot add-ons to agentic AI: systems that plan an analysis, pull the data, and explain their reasoning. Power BI’s Copilot drafts reports and summarizes visuals inside existing dashboards. Tableau’s AI features explain prediction logic in plain language. Databricks Genie and Snowflake Cortex Agents go further, reasoning over a request, calling tools, and returning a governed answer without anyone writing a query.
Gartner’s 2026 Magic Quadrant for Analytics and Business Intelligence Platforms, published on 29 June 2026, reflected the same direction of travel: Microsoft was named a Leader for the nineteenth consecutive year and Qlik for the sixteenth, with vendor evaluations centered on governed semantics and AI readiness rather than chart variety.
What the Shift Actually Means for You
- The skills bar drops, but does not disappear. Natural-language querying lets non-technical staff ask questions directly. Somebody still has to define what “active customer” means.
- Answers arrive with narrative. Auto-generated summaries cut the time spent interpreting a dashboard, which is often the slowest part of the loop.
- Adoption is earlier than the marketing suggests. Gartner’s 2026 CIO and Technology Executive Survey found only about 17% of organizations have deployed AI agents, while more than 60% expect to within two years.
Why the Semantic Layer Decides the Outcome
Asking a question in English is easy. Getting a correct answer is not. In a benchmark published by dbt Labs in April 2026, raw text-to-SQL against an insurance dataset scored 84% to 90% accuracy depending on the model, while the same questions routed through a modeled semantic layer scored between 98% and 100%.
The accuracy gap matters less than the failure mode. A semantic layer tends to fail visibly, returning an error when a question falls outside what it covers. Raw text-to-SQL tends to fail invisibly, returning a plausible number that is wrong. For a metric that reaches a board slide, that difference is the whole argument.
This is also where explainable AI stops being an abstraction. If a BI agent cannot show which tables and filters produced a figure, nobody senior will act on it twice.
If you are evaluating BI software today, ask vendors what their agents can reach, how metric definitions are enforced, and what the audit trail looks like when an answer turns out to be wrong.
What BI Tools Realistically Deliver
Vendor case studies promise large percentage gains. Treat them as marketing rather than as forecasts for your own business, because the results depend far more on your data quality and process discipline than on the software. What BI reliably changes is more modest and more useful.
Faster and Better Informed Decisions
The clearest benefit is time. Questions that used to need an analyst, a ticket and a two-day wait get answered in minutes, which shortens the loop between noticing a problem and responding to it.
The second benefit is fewer arguments. Once the definitions are agreed and governed, meetings move from reconciling numbers to deciding what to do about them. Teams running predictive analytics on top of a clean BI foundation get further still, because their forecasts inherit definitions everyone already trusts.
Sharper Customer Understanding
BI joins behavioral, transactional and support data into one view of a customer relationship. That is what makes it possible to see which accounts are drifting toward churn, which cohorts justify acquisition spend, and which product changes actually shifted usage.
Behavioral analytics takes this further by connecting in-product actions to commercial outcomes. The constraint is rarely the tooling. It is whether your customer identifiers are consistent enough across systems for the join to be trustworthy.
Business Intelligence Tools vs Business Analytics
The two terms overlap in marketing copy but describe different jobs.
Understanding the Distinction
Business Intelligence Tools handle descriptive and diagnostic analytics. They tell you what happened and help you work out why, using data that already exists. Business Analytics is predictive and prescriptive. It estimates what is likely to happen next and recommends what to do about it, using statistical models and machine learning.
The difference is not sophistication. It is the direction the question points. “Why did Q2 margin fall?” is BI. “What will Q4 margin be if we hold pricing?” is analytics.
How They Complement Each Other
Neither works well alone. Predictive models built on ungoverned data produce confident nonsense; descriptive reporting without forecasting leaves you reacting rather than planning. Run together, BI supplies the trusted historical base that business analytics then extends forward. Most mature stacks share one semantic model across both.

Factors to Consider When Choosing BI Software
Most BI selections go wrong for the same reasons: the demo dataset was clean, the evaluation team was technical, and nobody costed the second year.
Integration with Existing Systems
Check that the platform connects natively to the systems you actually run, not to a generic equivalent. Ask how incremental refreshes work, what happens when a source schema changes, and whether the connector supports the authentication your security team requires. Teams standardizing on cloud infrastructure should also confirm the tool sits close to the warehouse rather than copying data out of it.
User-Friendliness and Adoption
Adoption, not capability, is what most BI projects fail on. Run the evaluation with the people who will use the tool weekly, using your own data and your own messy edge cases. If a non-technical colleague cannot answer a real question in a short session, the license count you eventually buy will be optimistic.
Governance, Security and Cost Control
Confirm how row-level security works, how data privacy obligations are met for personal data, and where processing happens. Then look hard at pricing. Consumption-based billing on queries, AI credits or compute can make the second year cost several times the first, particularly once agents start running queries on their own.
Where Business Intelligence Tools Are Used
Common Patterns Across Industries
Retailers use BI for inventory turnover, assortment and pricing analysis. Healthcare providers use it for capacity planning and quality reporting under tight privacy constraints. Financial services lean on it for risk, fraud and regulatory reporting. Manufacturers combine it with sensor data for yield and downtime analysis, and logistics teams pair it with geospatial analytics for routing and network design.
What these have in common is a repeated, high-volume decision where a small percentage improvement is worth real money. That is the shape of problem BI suits best.
What Separates Projects That Work
Successful BI programs tend to share three habits. They start with one decision that matters and instrument it properly, rather than building a dashboard library nobody reads. They assign ownership of metric definitions to a named person. And they retire reports that stopped being used, which keeps the surface small enough to trust.
The failures share habits too: no agreed definitions, no quality monitoring, and a tool bought before anyone named the question. As AI adoption across business operations has shown, adding a capable model to an unclear process produces faster confusion, and the same holds for automation initiatives built on BI output.
Conclusion
Business Intelligence Tools have stopped being a reporting convenience and become the layer that decides how quickly an organization can respond to what its own data is telling it. The market is growing accordingly, from a projected $43.7 billion in 2026 toward $81.5 billion by 2033.
The 2026 shift toward conversational analytics lowers the barrier to asking questions. It also raises the cost of a sloppy data model, because an agent answers just as confidently from bad definitions as from good ones. The organizations getting value did the unglamorous work first: agreed metrics, monitored quality, clear ownership.
Start with one decision your team makes repeatedly and cannot currently make well. Govern the definitions behind it, then expand. That is a smaller project than a platform rollout and far more likely to still be in use next year. For the wider picture, see our overview of big data analytics trends.
Found this useful?
Make SmartKeys a preferred source on Google, and our articles will surface more often in your Top Stories, AI Overviews, and AI Mode.
Add as Preferred Source