Most companies say they run on data. Far fewer can point to a decision that actually changed because of it. That gap is the real story of data-driven work.
The skills side is moving fast. The World Economic Forum’s Future of Jobs Report 2025 estimates that nearly 40% of the skills people need on the job will change by 2030. It also projects 170 million new roles against 92 million displaced, a net gain of 78 million jobs, and finds 63% of employers name the skills gap as their biggest barrier to transformation.
This guide covers what data-driven work means in practice, which skills are worth building, what the big data infrastructure behind it looks like, how to make business intelligence useful rather than decorative, and which rules apply when software makes decisions about staff.
Key Takeaways
- Nearly 40% of job skills are expected to change by 2030, and 59 of every 100 workers will need training (WEF, 2025).
- Data-driven work means deciding from evidence you can check, not from unread dashboards.
- Data access and quality, not model choice, are what most often stall analytics and AI projects. Gartner puts the average cost of poor data quality at $12.9 million a year per organisation.
- US employment for data scientists is projected to grow 33.5% between 2024 and 2034, against 3.1% for all occupations.
- From 2 August 2026, EU transparency rules apply when staff or customers interact with an AI system.
What Data-Driven Work Actually Means
Data-driven work means basing a decision on evidence someone can inspect, rather than on seniority or instinct. That is the whole idea. Everything else is plumbing.

An example makes it clearer. A support team believes tickets spike on Mondays, so it staffs up. A data-driven version checks the actual arrival times, finds the spike is Tuesday afternoons after a weekly release, and moves two people. Nobody needed a machine learning model. They needed one number that was easy to look up and hard to argue with.
Both kinds of evidence count. Quantitative data covers what happened: response times, conversion rates, churn. Qualitative data covers why: exit interviews, support transcripts, call notes. Teams using only the first tend to optimise the wrong thing.
Why It Matters Now
Data became cheap to collect, and AI tools made it cheap to query. The hard part did not change: agreeing what a number means, then acting on it.
Cloudera’s 2026 Data Readiness Index, based on 1,270 IT leaders at companies with 1,000 or more staff, found nearly 80% say limited data access across systems is holding their AI work back. Only 18% described their data as fully governed. The constraint is rarely the analysis. It is reaching trustworthy data at all, which is why a clear data governance strategy pays off before any tool purchase.
How Technology Changed Work Dynamics
Digital tools changed who can see information. A regional manager who once waited for a monthly report now opens a live dashboard. That is progress, and also a new problem: more numbers reach more people with less context attached.
AI widened that access again. McKinsey’s State of AI survey published in August 2026 found 80% of people using AI in their own role say it improved their personal productivity. The organisational picture is soberer: 37% attribute any EBIT impact at all to AI, and just 6% qualify as high performers, roughly flat on the year before.
Real individual gains alongside thin company-level returns usually means the tools were adopted but the surrounding process was not redesigned.
What Data Analytics Really Does for Decisions
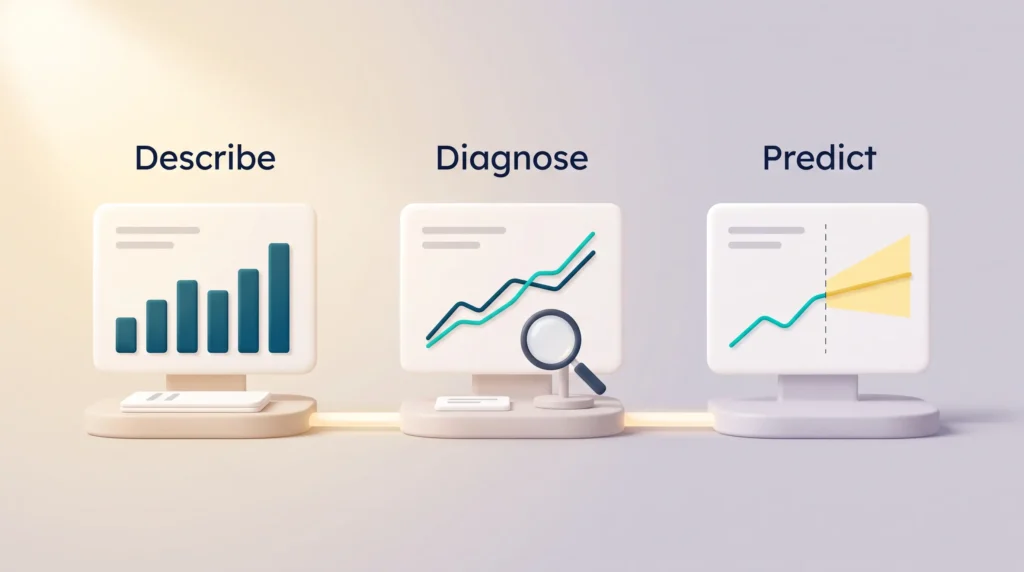
Analytics does three things, and keeping them apart helps. It describes what happened last quarter, diagnoses which factor moved with the result, and predicts what is likely next with a stated margin of error. Most business value still comes from the first two, done well and quickly, rather than from a sophisticated forecast built on shaky inputs.
The pattern repeats across sectors. Hospitals use readmission data to decide which discharged patients get a follow-up call. Retailers use sales and stock data to decide what to reorder. In each case the win is one operational decision made faster, not a general improvement in intelligence.
Two cautions are worth stating plainly. Correlation in a dashboard is not a cause, and acting as though it is produces confident mistakes. And a metric that becomes a target usually stops measuring what it used to. If you want a deeper look at how the discipline is developing, our overview of the future of business analytics covers the direction of travel, and AI in decision making covers where automated judgement is and is not appropriate.
The Jobs and Skills That Are Actually Growing
Forecasts about job losses get the headlines. The verifiable numbers are narrower and more useful. The US Bureau of Labor Statistics projects employment of data scientists to grow 33.5% between 2024 and 2034, adding about 82,500 jobs. Information security analysts are projected to grow 28.5%, software developers 15.8%, against 3.1% for all occupations combined. These roles are growing several times faster than the labour market, from a comparatively small base.
For most people the question is not “should I become a data scientist” but “which data skills make me better at the job I already have”. Our guides to the skills most in demand and upskilling and reskilling cover the career side.
Data Skills Worth Building
- Reading a chart critically. Knowing what the axis hides, how big the sample was, and what is missing. The highest-return skill, and it needs no software.
- Working a dashboard tool. Tableau, Power BI or Looker Studio, at the level of filtering, grouping and building a simple view yourself.
- Basic statistics. Averages against medians, and why a small difference between two groups is often noise.
- Explaining a finding. Turning an analysis into a recommendation someone can act on. Our guide to data storytelling covers this.
- Enough machine learning to ask good questions. What the model was trained on, and what happens when it is wrong.
Predictive Modelling, Explained Simply
Predictive modelling means using past patterns to estimate something you cannot yet observe: which customers are likely to cancel, which machines are likely to fail, which roles will be hard to fill next year.
It is useful, with one condition. A model reproduces the past, including any bias in it: if your historical promotion data favoured one group, a model trained on it will too. That is why predictions about people need a human decision-maker and a documented reason, not an automatic action. Our pieces on predictive analytics in business and behavioural analytics cover how these models are built and where they break.
Making Business Intelligence Useful
Business intelligence (BI) is the layer that collects data from your systems and presents it so people can answer questions without writing code. It succeeds or fails on whether anyone uses it. A working setup usually shares four traits:
- Few metrics, clearly defined. One agreed definition of “active customer” beats five dashboards that each use a different one.
- Fresh enough data. Daily suits most decisions. Live data matters mainly where someone will act within the hour, as our piece on real-time data in business explains.
- A named owner per report. Reports without an owner drift out of date and quietly lose trust.
- Access for whoever makes the decision. Restricting analytics to a central team creates a queue. Opening it up, the idea behind data democratization, works only alongside training and clear definitions.
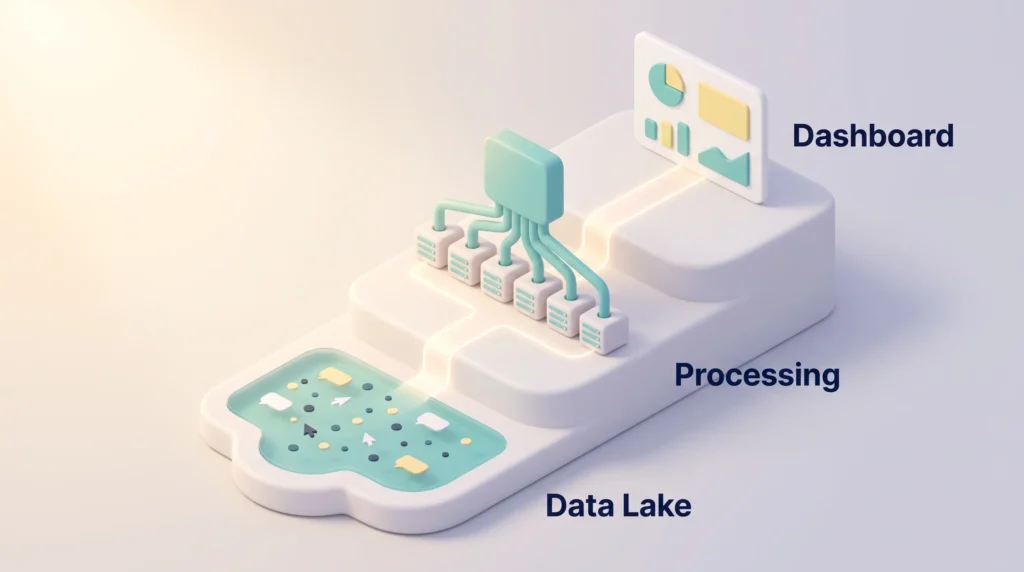
Underneath, most organisations store raw data in a lake or lakehouse and model it for reporting on top. Our explainer on data lakes and business intelligence covers that architecture, our comparison of business intelligence tools covers the platform choice, and the analytics maturity model helps you judge where you stand before investing further.
The Big Data Infrastructure Behind It
Big data simply means data sets too large, too fast or too varied for a spreadsheet or a single database to handle: every click on a website, every sensor reading from a warehouse, every message in a support queue. In the workplace, it is the raw material that dashboards and forecasts are built from. You do not need to run this infrastructure yourself, but knowing its basic shape helps you ask better questions of the people who do.
Cloud Platforms and Big Data
Most companies no longer build their own data centres for this. They rent storage and computing power from cloud providers such as Amazon Web Services, Microsoft Azure or Google Cloud and pay for what they use. The practical benefit is flexibility: a retailer can scale up processing for the holiday season and scale back down in January, instead of buying servers that sit idle for ten months.
The software underneath has changed too. Frameworks such as Apache Hadoop and Spark split a large job across many machines so it finishes in minutes rather than days. NoSQL databases, which store data without forcing it into fixed rows and columns, handle messy inputs like chat logs or product reviews that a classic database struggles with. Together with the data lakes described above, these tools are why analysis that once needed a specialist team can now sit behind an ordinary dashboard.
Cloud does not remove the security question; it moves it. Encryption, access controls and a clear record of who can see which data still have to be set up deliberately, especially for employee and customer records.
Common Big Data Management Problems
The technology is rarely what fails. The same four problems come up again and again:
- Poor data quality. Duplicate customers, outdated contact details and inconsistent field names quietly break every report built on top of them. Gartner estimates that poor data quality costs organisations an average of $12.9 million a year.
- Time lost to preparation. Cleaning, matching and reshaping data typically eats far more of a project than the analysis itself. Automating the routine parts of that preparation frees analysts for the questions that matter.
- Privacy and compliance. The more personal data you collect, the more you must justify, protect and eventually delete. Collecting less, on purpose, is often the cheapest safeguard.
- Too few people who can run it. Skilled data engineers are scarce, which is one more reason to train existing staff rather than rely on hiring alone.
Turning Data Into Decisions People Act On
Most data programmes are lost in the gap between a correct analysis and a changed decision. Three habits close it.
Start from the decision, not the data. Ask what someone will do differently depending on the answer. If nothing changes either way, the analysis is optional.
Show uncertainty. A range with a confidence level is more honest than a single number presented as fact.
Put the number where the work happens. A metric inside the tool a team already uses gets acted on. The same metric in a weekly email does not.
Tools for Data Visualization
- Tableau: strong for interactive exploration and for analysts who build views for others.
- Microsoft Power BI: the usual default where a company already runs Microsoft 365, and cheaper per seat at entry level.
- Looker Studio: free, browser based, and adequate for marketing and web reporting.
The choice matters less than the discipline around it: a clear chart in a free tool beats a confusing one in an expensive tool. Augmented analytics features, where the software suggests what to look at, are standard across all three. Treat those suggestions as prompts to investigate, not conclusions.
Building Analysis Into Daily Operations
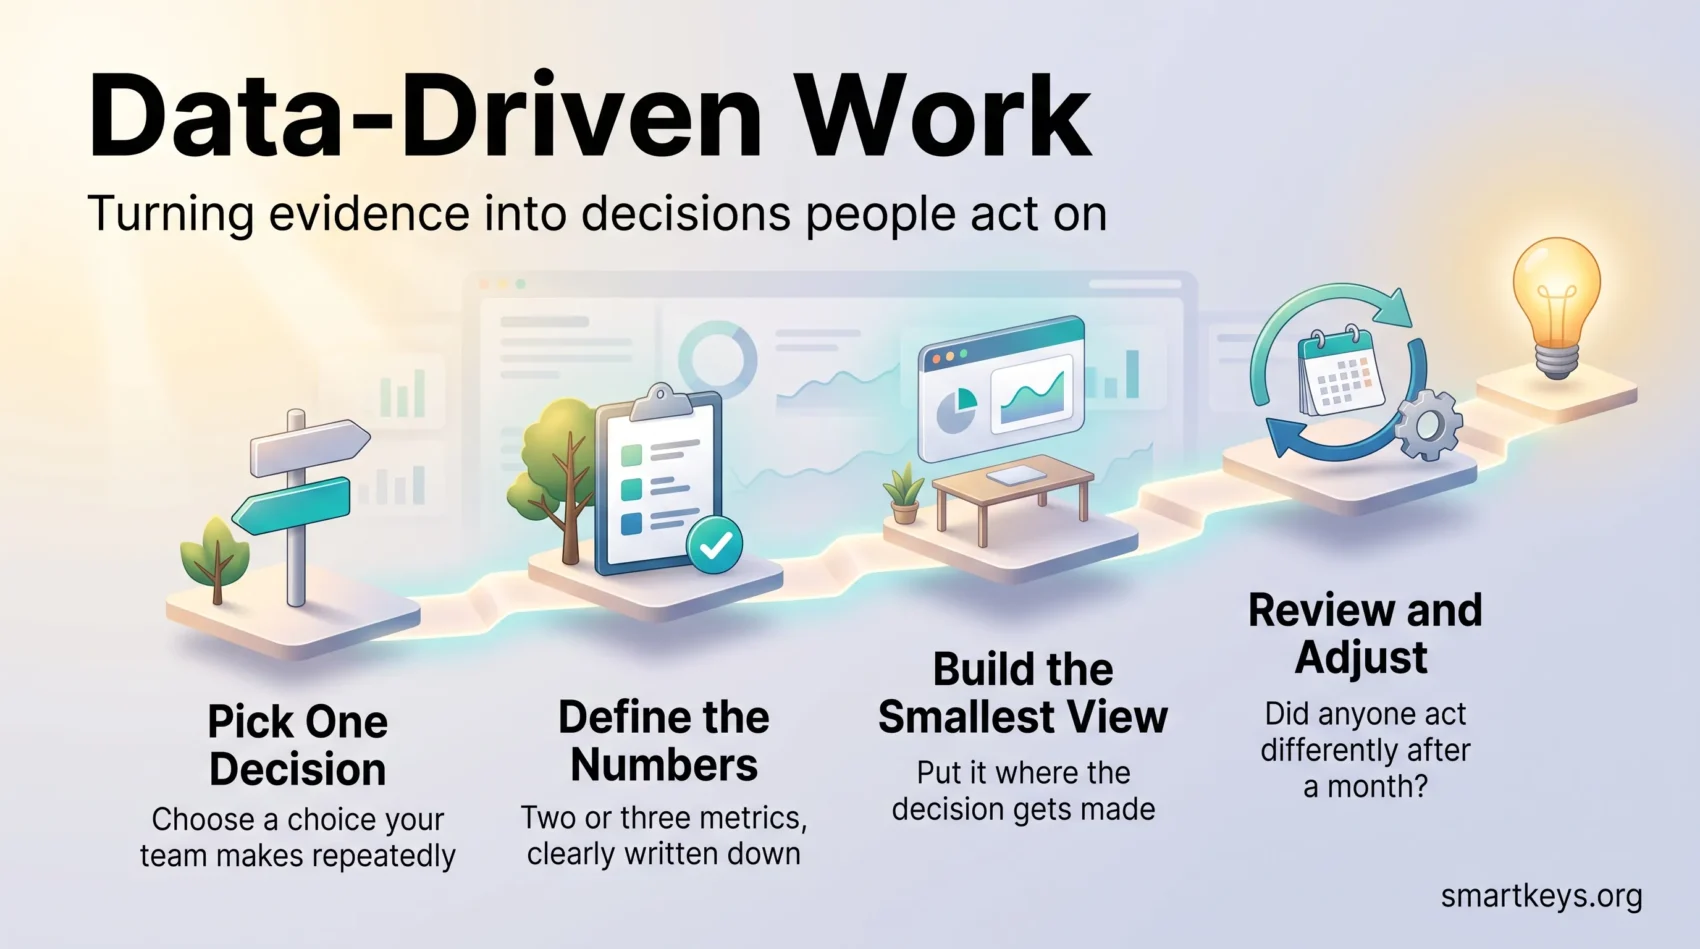
- Pick one decision your team makes repeatedly, such as which leads to call first or which shifts to staff more heavily.
- Define the two or three numbers that decision depends on, and write down what each one means.
- Build the smallest view that shows them, and put it where the decision gets made.
- Review after a month: did anyone change what they did? If not, fix the decision, not the chart.
Building a Continuous Learning Culture
The WEF report found 59 of every 100 workers will need training by 2030, and 11 of them are unlikely to receive it. Closing that gap is a management problem before it is a training problem. What tends to work:
- Protected time. Training that competes with delivery targets loses.
- Learning tied to a real task, so the skill gets used within a fortnight.
- Internal teaching, where whoever solved something shows the team how.
- A structured programme rather than a licence to a course catalogue. Our guides to remote corporate training, AI learning platforms and running a data literacy programme with role-based training cover the practical setup.
Measure it by whether people apply the skill. Course completion rates are easy to report and tell you almost nothing.
Data-Driven Talent Management
Electronic HR systems, usually shortened to e-HRM, hold the record of who works where, what they can do and how they are progressing. Used well, they answer questions that used to require guesswork: which teams are short of a critical skill, where internal candidates already exist, which roles take longest to fill.
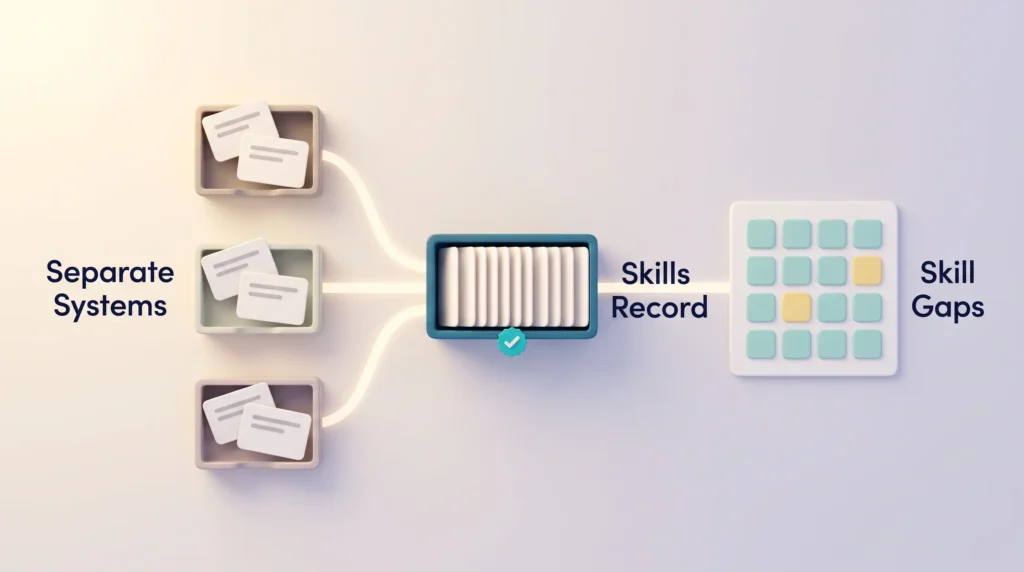
The evidence suggests most organisations are not there yet. HR.com’s State of People Analytics 2025-26, a survey of 201 HR professionals fielded in late 2025, found 23% rate their organisation as very or extremely effective at people analytics, while 50% say integrating data from multiple systems is difficult. Only 26% often combine HR data with data from elsewhere in the business.
So the realistic first step is not a prediction engine. It is one reliable, current record of skills and roles. From there, AI in HR management becomes measurable rather than anecdotal, and analytics tools have something trustworthy to work with. When you reach that point, our guide on how to choose workforce analytics software for HR compares the main tool categories and what to check before a pilot.
Supporting Up- and Re-Skilling
Employee reskilling works best when the gap is specific. “Improve digital skills” produces nothing; “everyone in operations can build a filtered view in Power BI by June” produces a plan. A digital skills gap analysis gets you from the first sentence to the second.
The Rules That Now Apply
If your data work touches employees or customers, compliance belongs in the design rather than at the end.
Since 2 August 2026, the EU AI Act’s transparency obligations apply. People must be told when they are interacting with an AI system unless it is obvious, AI-generated content must be marked, and anyone exposed to emotion recognition or biometric categorisation must be informed. Systems already running before that date have until 2 December 2026 to meet the marking rules.
The stricter high-risk rules covering AI in recruitment, promotion and task allocation were postponed by the Digital Omnibus agreement and now apply from 2 December 2027 for standalone systems. Postponed is not cancelled, and the preparation is the same either way: know what the system does, document why it was used, keep a human in the decision. Our summaries of EU AI Act compliance and data privacy at work cover the detail.
Conclusion
Becoming data-driven is less about technology than most vendors suggest. The organisations that get value share a short list of habits: they define their metrics once, fix data access before buying another tool, start from a decision rather than a dataset, and train people to question a chart rather than accept it.
Nearly 40% of job skills are expected to change by 2030, data science roles are growing at roughly ten times the rate of the labour market overall, and most companies still cannot show a financial return on their AI spend. Those three facts point the same way. The advantage is not in owning the tools. It is in the less glamorous work of making the data trustworthy and the decisions accountable.
Found this useful?
Make SmartKeys a preferred source on Google, and our articles will surface more often in your Top Stories, AI Overviews, and AI Mode.
Add as Preferred Source