Analytics maturity describes how far your company has come in turning raw data into decisions people trust. In a low-maturity company, two teams bring two spreadsheets to a meeting and argue about whose number is right. In a mature one, everyone accepts the number and argues about what to do next.
This guide explains the stages, shows how to work out where you stand, and gives you a roadmap that does not start with buying software.
Progress is rarely even. Marketing may run polished dashboards while finance still exports spreadsheets by hand. That mix of strengths and gaps is normal, and fixable.
Key Takeaways
- Maturity is measured in capabilities and outcomes, not in the number of tools you own.
- Expect an uneven picture: most companies are advanced in one area and behind in another.
- Data quality, governance and culture are what unlock everything above them.
- Ask questions your data can actually answer, then upgrade the data to answer better ones.
- Small, repeatable wins build capability faster than one large platform project.
Why analytics maturity matters in 2026
Artificial intelligence turned a slow-moving topic into an urgent one. The bottleneck in most companies is not the model. It is what the model is fed. Your maturity stage also decides which of the broader shifts in business analytics you can realistically put to work.
Gartner surveyed 353 data, analytics and AI leaders in late 2025 and published the results in April 2026. Companies with successful AI initiatives invest up to four times more of their revenue in data and analytics foundations than those with poor AI results. The most mature in AI-ready data reported 65% greater business outcomes. Even so, only 39% of technology leaders were confident their current AI spending would improve financial performance.
Gartner also expects more than 40% of agentic AI projects to be cancelled by the end of 2027. Agentic AI means software that carries out multi-step tasks on its own rather than answering a single prompt. The reasons given are unclear business value and rising costs, not weak models.
The reading is simple. If your definitions, pipelines and ownership are shaky, adding AI to your business operations multiplies the confusion instead of removing it.
The cookie deadline vanished, the data problem did not
For years the advice was to prepare for a web without third-party cookies. That deadline never arrived. Google abandoned its planned cookie choice prompt in April 2025 and retired the Privacy Sandbox project in October 2025, so third-party cookies remain in Chrome with no removal date.
Consent obligations did not change with it. Under the GDPR and comparable US state laws you still need valid consent before tracking someone, whatever Chrome allows by default. Keeping up with current data privacy rules remains part of the job.
Signal quality matters for a plainer reason: attribution goes wrong without it. Credit sneaker sales to the profile browsing the site and you credit teenagers for purchases their parents pay for. Budget then follows the wrong audience. That is why a first-party data strategy and, where it fits, zero-party data that customers hand over deliberately are worth the effort.
What the analytics maturity model actually is
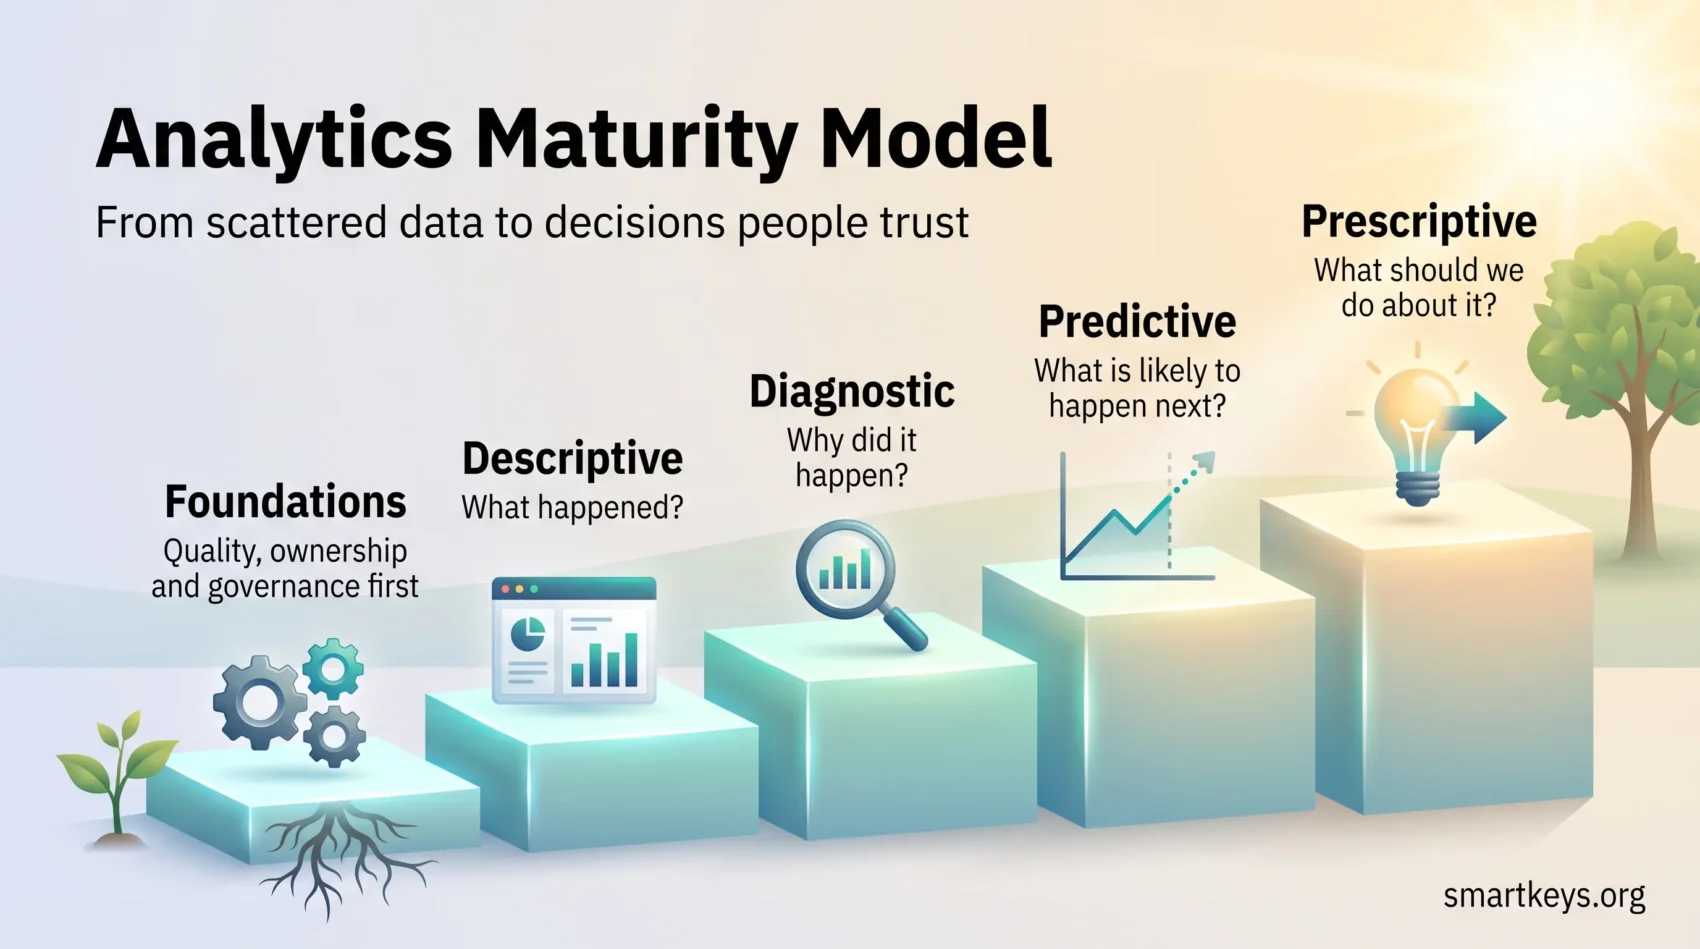
Think of it as a map rather than a scorecard. It lists the stages a company passes through as it learns to use data and describes what is true at each one. You use it to find your position, name the gaps and agree the next step.
Foundations come first. Data management and data governance are prerequisites for anything above them. Skipping them is how companies end up with impressive forecasts built on numbers nobody trusts.
The four questions behind every stage
Gartner’s version of the ladder is built on four business questions, and they are easier to remember than the jargon:
- Descriptive analytics: what happened?
- Diagnostic analytics: why did it happen?
- Predictive analytics: what is likely to happen next?
- Prescriptive analytics: what should we do about it?
Each question demands more from your data than the last. A dashboard tolerates a missing week. A forecast does not.
How the best-known frameworks compare
- Gartner: organised around those four business questions, so it is easy to explain to leadership.
- TDWI: a scored assessment across organisation, infrastructure, data management, analytics and governance, useful for a baseline number.
- DAMA-DMBOK: a reference body of knowledge for data management, strongest on governance, quality and stewardship.
Pick one and adapt it. Running two at once produces debate about frameworks instead of progress.
The stages, from unstructured to cognitive
The ladder runs from scattered files to automated recommendations. Most companies straddle two rungs in the middle.
Unstructured
No agreed strategy, data spread across personal drives, analysis done on request. Reports are rebuilt from scratch each time and nobody can reproduce last quarter’s number.
Foundational
Ownership is named, sources catalogued, pipelines documented. Dull work, and the stage that pays for every later one. Data lakes and warehouses usually appear here.

Descriptive analytics
Consistent definitions, trend views and benchmarks. One revenue number, one definition of an active customer, one place to find both. Business intelligence tools do most of the work here.
Diagnostic analytics
You compare periods, segments and regions to find causes. The useful output is not a chart but a sentence: renewals fell because onboarding calls slipped two weeks in March.
Predictive analytics
Historical patterns are used to estimate what comes next: churn risk, demand, cash position. This is where machine learning starts to earn its place, and where predictive analytics in finance and predictive analytics in wider business decisions offer concrete examples.
Prescriptive analytics
The system recommends an action under constraints: shift this much budget, reorder this quantity, call this account first. Because people must act on the output, explainable AI stops being a nice extra and becomes a requirement.
Cognitive analytics
Near real-time insight at scale, combining machine learning with language models that read free text such as support tickets and reviews. This stage works only once the earlier ones hold, and it depends on real-time data flowing reliably.
Start where you are. Build the basics, then add complexity with confidence.
How to assess where you stand today
Begin with an audit you can finish in a week. You are looking for facts, not a maturity score to put in a deck.
Inventory your sources and access
List internal sources (CRM, website analytics, support tickets, finance systems) and external ones (ad platforms, public datasets). For each, note the owner, how fresh it is, and who can query it. If one person is the only route to a table, that is a finding.
Check governance and definitions
Ask who decides what “active customer” means and where that is written down. Conflicting definitions are the commonest reason two dashboards disagree. A customer data platform helps, but only after the definitions exist.
Ask questions that go past totals
Totals tell you little. Track the behaviour that explains why customers convert or leave, and tie each metric to a decision someone makes. If no decision depends on a number, stop reporting it.
Talk to the people who use the output
Ask three teams what they do with the reports they receive. The answers expose silos faster than any survey. Where access sits with one central team, requests queue and people fall back on guesswork.
A roadmap that survives a real quarter
Aim for small, repeatable wins that prove the value of better data. Large platform projects are hard to defend when the first result is a year away.
Start with people and process
Define roles and handoffs, then run short review cycles so findings reach the people who act on them. A data literacy program helps non-specialists read output correctly, and data storytelling keeps analysis from dying in an inbox.
Fix quality before you add models
Repair lineage, definitions and ownership first. Every dashboard and model downstream inherits whatever you leave broken here.
Match tools to your stage
Buy for the rung above you, not three above. Business intelligence for reporting, a warehouse for scale, machine learning platforms only once you have something worth putting into production. Augmented analytics features can shorten the path for smaller teams.
Set the guardrails early
Decide who signs off on automated decisions and what gets logged. An AI governance model written before deployment costs far less than one written after an incident, and companies operating in Europe should check their duties under EU AI Act compliance.
Move from forecast to recommendation
Run controlled experiments, build what-if scenarios, then let the system suggest the next action. Pairing that with clear decision-making models keeps a human accountable for the call.
A worked example
A marketing team starts with a dashboard showing spend and conversions by channel. Next quarter it diagnoses which channels bring repeat buyers rather than first orders. After that it forecasts seasonal demand and shifts budget on predicted lift, the progression behind most e-commerce personalization programmes. Each step reuses the definitions built in the one before.
Conclusion
Reliable reports come first. Forecasts and recommendations come later. Do not rush into AI: the Gartner figures point the same way each year, and the companies seeing returns funded the unglamorous foundations first.
Pick one or two pilots this month, measure the outcome, and tell leadership what changed. Then revisit your position on the ladder and choose the next rung.
Found this useful?
Make SmartKeys a preferred source on Google, and our articles will surface more often in your Top Stories, AI Overviews, and AI Mode.
Add as Preferred Source