Last Updated on January 29, 2026
This concise guide shows you how to connect sales, marketing, and customer success so your organization can drive predictable revenue and faster growth.
You’ll learn which numbers matter, how to translate business goals into clear actions, and how dashboards and weekly reviews keep your team aligned. The focus is practical: clean data, easy formulas, and forward-looking pipeline measures that help you act before quarters end.
Expect simple definitions for ARR, MRR, CAC, CLV/LTV, NRR, conversion rates, and churn so your teams compare apples-to-apples. We also cover how to attribute marketing’s impact, set SLAs with sales, and protect value through CSAT and NPS.
The result is a repeatable operating system that boosts efficiency, supports forecasting, and gives leaders confidence in the numbers. Use this as a compact guide to unify your operations and keep customers at the center of growth.
Key Takeaways
- Align sales, marketing, and success around shared revenue goals.
- Use clean data and simple formulas for ARR, MRR, CAC, and LTV.
- Employ forward-looking pipeline and sales velocity to act early.
- Attribute marketing’s influence and agree on SLAs with sales.
- Track CSAT and NPS to protect customer value and reduce churn.
- Run real-time dashboards and weekly reviews to keep the business aligned.
What RevOps is and why metrics are your growth engine
When systems, data, and process align across the customer lifecycle, your revenue engine becomes predictable and actionable.
Revenue operations is an operating model that unites sales, marketing, and customer success so your team works from one source of truth. It covers the full lifecycle and makes handoffs smooth. That reduces friction and speeds up growth.
Observability means instrumenting systems and processes so you can see performance in real time. With the right data you turn numbers into decisions and free resources for high-impact work.
Big-picture KPIs vs. department-level views
revops metrics track holistic revenue performance across functions. Department measurements focus on local activity like call volume or ad CTR. Both matter, but you report the signal that drives the organization.
- Use ARR/MRR as your north star for predictability.
- Keep a few forward-looking indicators for pipeline health.
- Agree shared definitions so teams measure the same thing.
51.3% of practitioners rank ARR/MRR as top for leadership. And 89% say defining KPIs is core to their role. If you want practical guidance on trends and adoption, see revenue operations trends.
Why RevOps metrics matter right now
Your business needs forward-looking visibility so teams can act weeks before quarter end.
Leadership and boards fixate on ARR and predictable recurring revenue because visibility reduces last-minute scrambles and protects investor confidence.
NRR often signals long-term revenue growth better than new MRR alone. If renewals and expansion slip, growth stalls even with new sales.
Tracking customer acquisition cost alongside lifetime value helps you decide if higher acquisition cost is acceptable for a high-value channel.
Conversion rate trends, average deal size, and early forecast deltas give your teams time to intervene. Weekly dashboards and reviews turn raw data into faster decisions.
Present-day priorities: predictable revenue, efficiency, and investor confidence
- You need reliable visibility into recurring revenue and pipeline confidence to avoid end-of-quarter surprises.
- Use ARR/MRR for predictability and NRR to check if your existing book can support revenue growth.
- Watch acquisition cost in context with lifetime value so you don’t cut high-value channels by mistake.
- Let churn warnings trigger coordinated outreach from sales, marketing, and customer success to protect value.
In short: surface recurring revenue, pipeline coverage, and profitability signals to leadership so your business narrative is crisp and teams can act immediately.
Align KPIs to business goals before you measure
Aligning goals and KPIs up front prevents conflicting incentives and speeds decisions across teams. Start by naming the business outcome you want — for example, a 20% revenue increase next quarter — then break that into specific targets for each function.
From business outcomes to SMART KPIs
Make KPIs SMART: specific, measurable, achievable, relevant, and time-bound. For a 20% revenue target you might set +10% sales and −5% churn as concrete objectives.
Choose a small core set of indicators that ladder to the goal. Include leading signals like conversion and pipeline coverage so you can course-correct in time.
Cross-functional KPI alignment: sales, marketing, and customer success
Agree shared definitions — what counts as a qualified lead or a closed renewal — and document the process for updates. That avoids disputes and keeps your organization focused on outcomes.
- Map owners and handoffs so each metric has a clear accountable person.
- Align capacity and budget with targets so goals are realistic, not aspirational.
- Run weekly reviews with dashboards so teams bring data, discuss blockers, and adjust tactics fast.
“Set governance: who can change KPIs, how changes are logged, and how customers stay central to every measure.”
RevOps metrics explained
Understanding which indicators lead and which lag turns noisy reports into actionable insight.
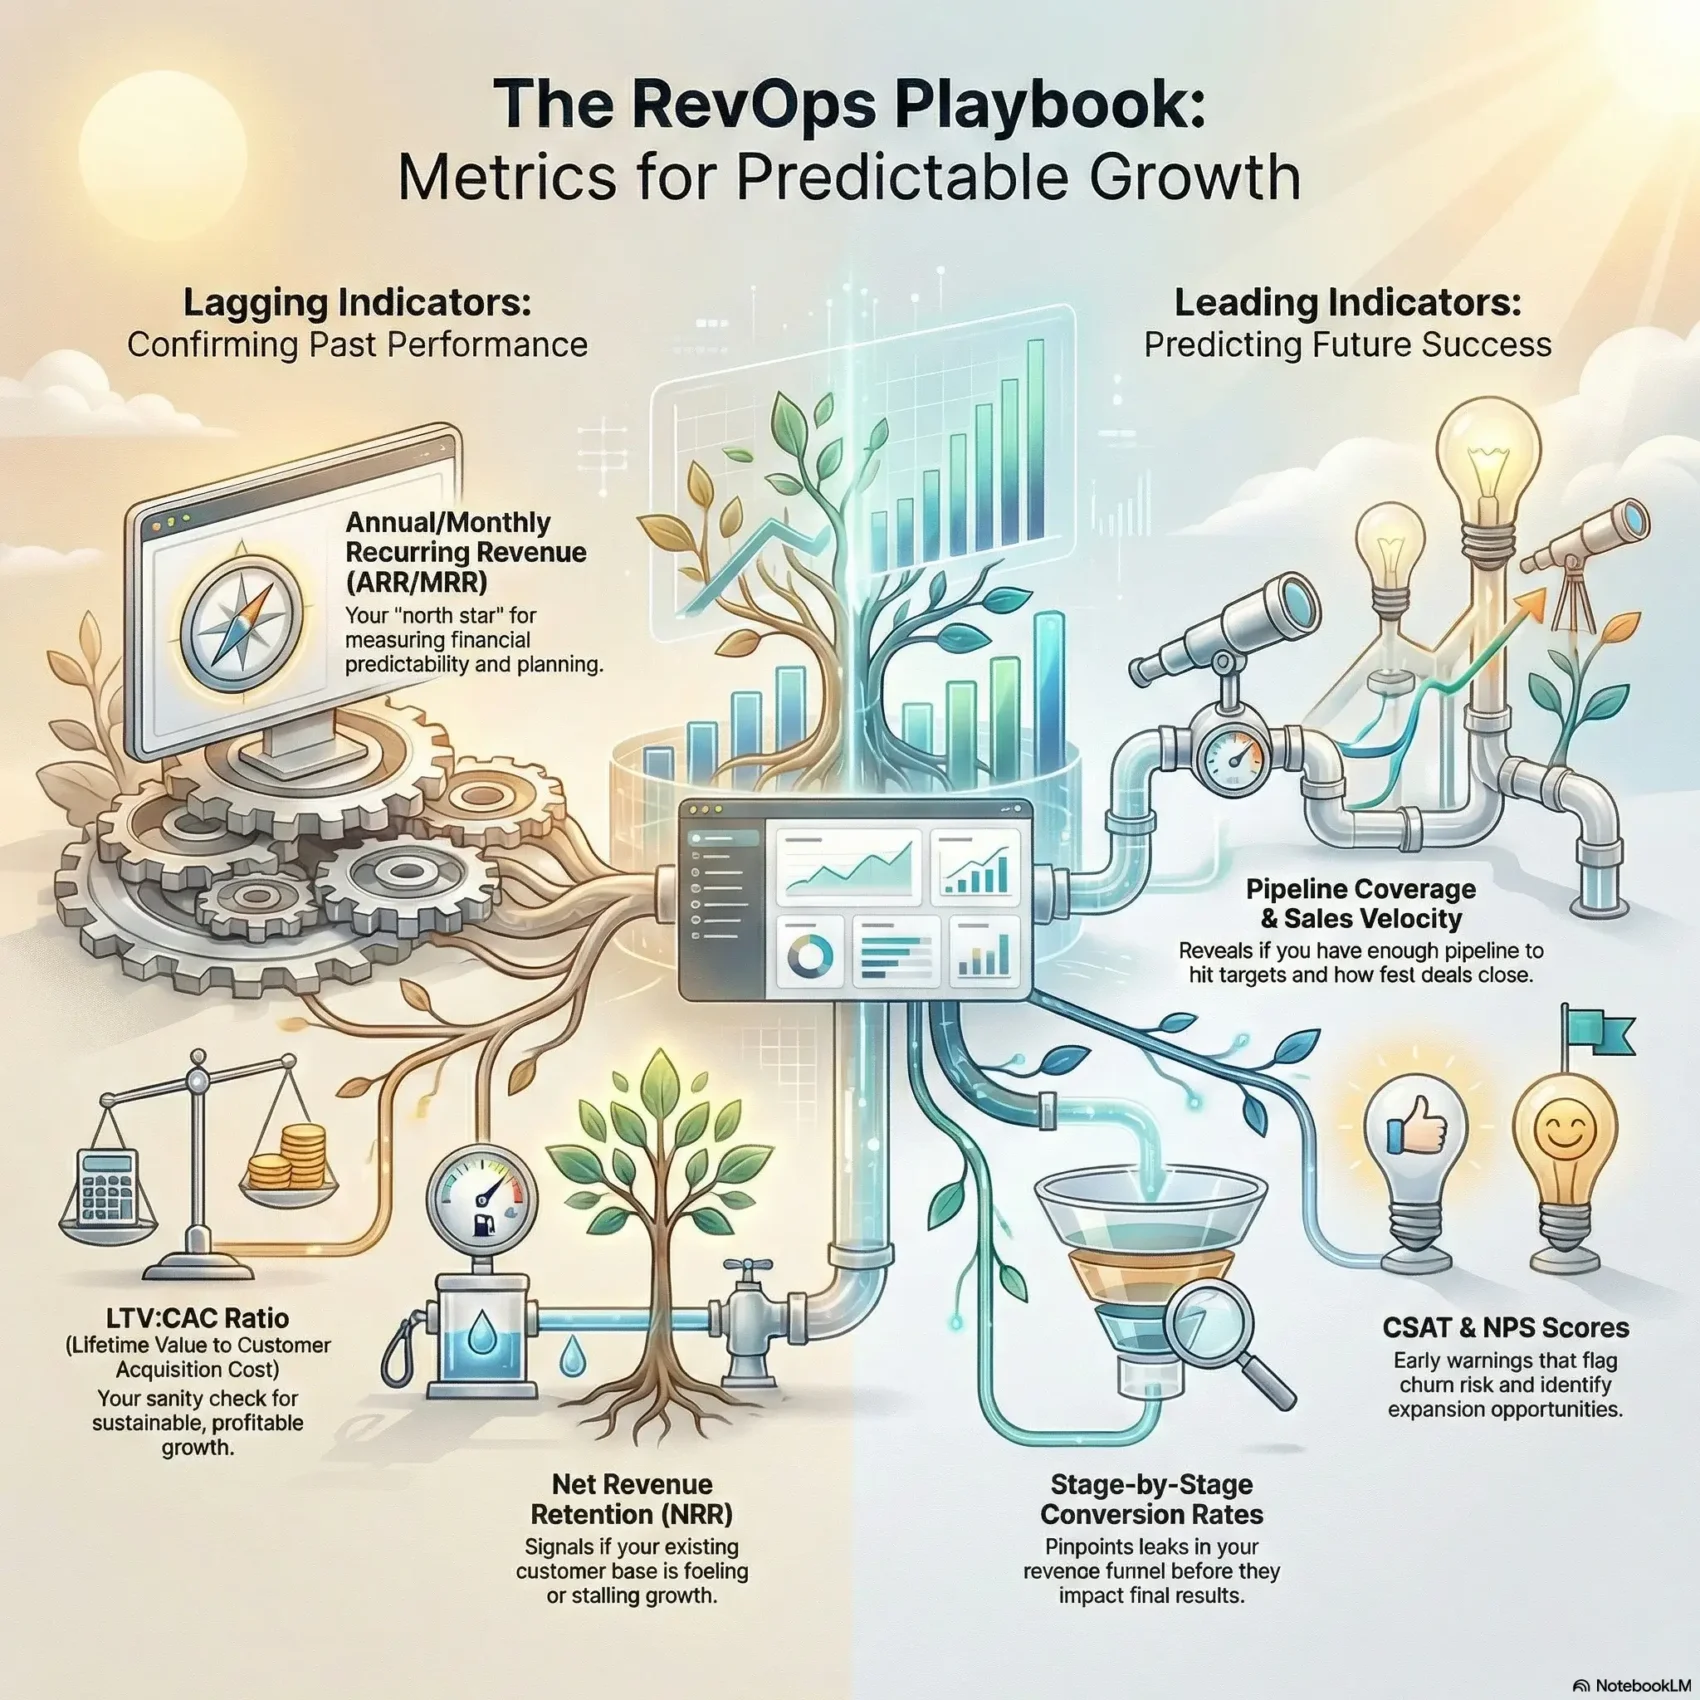
Leading vs. lagging indicators across the revenue engine
Lagging outcomes tell you what already happened. Examples include ARR/MRR, closed revenue, win rate, and NRR. These are essential for reporting and investor updates.
Leading signals predict where revenue will land. Track weighted pipeline value (deals × ACV × win rate), pipeline coverage ratio, sales velocity (pipeline value ÷ avg. sales cycle), and conversion rates at each funnel stage.
- Include customer-focused early warnings: CSAT, NPS, and product adoption to flag churn risk and expansion potential.
- Standardize formulas and shared data sources so all teams calculate the same metric the same way.
- Set thresholds and time windows so you catch declines in conversion or deal progression before quarter end.
“Lead indicators give you time to act; lagging outcomes confirm whether the action worked.”
Operations keeps these measures reliable, and you translate leading signals into plays—content, outreach, or enablement—to protect pipeline value and improve forecast accuracy.
Revenue foundations: ARR, MRR, and revenue growth rate
Start with the revenue basics so your team can plan hiring, product bets, and marketing spend with confidence. Annual and monthly recurring figures give you both predictability and the ability to act quickly.
ARR and MRR for predictability and planning
Annual recurring revenue (ARR) is the sum of recurring revenue over a 12‑month period. For example, 1,500 customers at $300/year = $450,000 ARR.
Monthly recurring revenue (MRR) is the same idea measured monthly. Example: 500 subscribers at $20/month = $10,000 MRR.
Anchor your operating model on these numbers so finance, operations, sales, and marketing can plan headcount, programs, and investment with the same trusted data.
Revenue growth rate to track acceleration or stagnation
Measure growth as: (Revenue this period − Revenue last period) ÷ Revenue last period × 100%. This single number tells you whether growth is accelerating or stalling.
- Segment growth by product, cohort, or customer lifetime to spot expansion or churn.
- Use regular reviews so leaders have current numbers and can course-correct fast.
“Boards ask about ARR because recurring revenue visibility drives hiring and investment decisions.”
Acquisition and value economics: CAC, CLV/LTV, and LTV:CAC
Knowing the true cost to win a customer and the value they deliver over time lets you spend where returns are highest.
Customer acquisition cost: inputs and formula
Customer acquisition cost equals total marketing and sales spend divided by the total number of new customers. For example, $200,000 spend ÷ 400 new customers = $500 CAC.
Include all acquisition cost inputs—ads, events, SDR salaries, agency fees—so channels compare fairly.
Customer lifetime value: prediction and drivers
Estimate customer lifetime value as annual revenue per customer × expected lifetime in years − CAC.
Retention rate, expansion, pricing, and onboarding speed materially change lifetime value. Improve early product value to shorten payback and lift LTV.
LTV:CAC ratio to evaluate sustainable revenue growth
Use the LTV:CAC ratio as your sanity check. A higher ratio means you can justify more acquisition cost if lifetime returns exceed spend.
- Segment CAC and CLV by channel to spot the best ROI.
- Accept higher cost for strategic market entry when lifetime value supports it.
- Align sales and marketing on definitions like “new customer” to keep your data clean.
“Measure both sides of the equation—what you pay to acquire and what customers return over time.”
Funnel health and conversion rate benchmarks
Pinpointing stage-level leakage helps your sales and marketing teams focus on the fixes that matter.
Lead Conversion Rate (LCR) = successful conversions ÷ total leads × 100%. For example, 80 customers from 1,000 leads = 8% LCR.
Lead conversion and win rate across stages
Measure conversion end-to-end and by stage to find where revenue slips away. Track stage-by-stage conversion and win rate to reveal bottlenecks.
- Measure LCR overall and per stage so you know exactly where to intervene.
- Compare win rate with stage progression to target coaching and process fixes.
- Align sales and marketing on qualification so handed-off leads convert at higher rates.
- Use your historical baseline and industry benchmarks for a fair read.
- Track conversion by channel and campaign to shift spend toward proven revenue drivers.
“Small early-funnel gains compound into outsized downstream growth.”
Standardize data capture, run weekly reviews, and assign owners. That way you link conversion shifts to forecast updates and keep leaders confident about growth.
Pipeline, forecasting, and sales velocity
Measuring how fast deals move and how much value sits in your pipeline helps you make better daily decisions. Use simple formulas and a tight weekly cadence so leadership trusts the numbers and your teams act early.
Weighted pipeline value and coverage ratio
Weighted pipeline value = number of deals × ACV × win rate. This gives a realistic dollar view of what’s likely to close.
Compare that to quota using a coverage ratio so you know if you have enough pipeline to hit revenue targets.
Sales velocity and sales cycle length
Sales velocity = pipeline value ÷ average sales cycle length. That yields dollars per day and highlights where time slows deals.
Shortening the cycle raises velocity without adding headcount.
Predictability, customer acquisition, and churn forecasting
Track variance between forecasts and actuals to build forecast credibility. Forecast customer acquisition by channel and segment so marketing and SDRs pace replenishment.
Build an early-warning churn forecast to protect net revenue by coordinating success, product, and account teams.
“Quantify pipeline quality, run weekly reviews on conversion and aging, and communicate confidence levels clearly.”
For a deeper look at industry adoption and trends, see revenue operations trends.
Sales productivity and efficiency metrics
Track productivity in sales to surface the simple fixes that speed deals and lift revenue.
Quota attainment and average deal size
Quota attainment shows whether targets match reality. Persistent misses often point to process gaps, training needs, or poor lead quality.
Watch average deal size trends to coach toward higher-value outcomes—upsells, cross-sells, and packaging that raise customer value.
Sales cycle length to average deal size ratio
Calculate sales cycle length as total days for all closed deals ÷ number of deals. Example: 750 days ÷ 50 deals = 15 days.
Compare cycle length to average deal size. If time rises without ACV lift, you have a process issue that drains pipeline momentum.
Revenue per employee as a scale-efficiency signal
Revenue per employee = total revenue ÷ headcount. Mature businesses usually show higher RPE as processes scale.
Use this number to validate hiring, territory coverage, and investment decisions.
- Track quota attainment and root causes weekly.
- Relate deal size to cycle time to catch inefficiencies early.
- Align marketing and sales on lead quality so reps work on opportunities that convert.
“Short weekly inspections of aging deals and clear playbooks for acceleration cut time-to-close and protect pipeline value.”
Marketing’s impact: sourced and influenced revenue, CPL, and ROI
You need a clear way to separate revenue directly sourced by campaigns from the broader influence marketing has across the funnel.
Marketing-sourced vs. marketing-influenced revenue
Marketing-sourced revenue counts deals that began with a tracked marketing lead. This is the neat, attributable slice leadership often asks for.
Marketing-influenced revenue captures non-linear influence — visits, content touches, and nurture flows that later help close deals. Use multi-touch attribution to see that wider contribution.
CAC and lifetime value by channel
Break out customer acquisition cost and customer lifetime value by channel so you can compare true ROI. Channels with higher CAC can still win if their lifetime value justifies the spend.
Cost per lead and campaign ROI for better budget decisions
Calculate cost per lead and campaign ROI to shift budget toward programs that create pipeline and recurring revenue.
- Agree attribution rules up front — first, last, and multi-touch each tell part of the story.
- Measure speed-to-lead and follow-up SLAs with sales to lift conversion where it matters most.
- Include existing customers in campaign tracking to capture expansion and renewal value.
“Read influenced revenue alongside sourced revenue so you reward the mix of brand and demand that truly grows ARR.”
Customer success and retention: churn, NRR, CSAT, and NPS
Retention protects revenue and fuels predictable growth. You want customers to stay, expand, and recommend you. That means tracking simple, leading signals and running fast save motions when those signals dip.
Churn rate and renewal rate for retention health
Calculate churn rate as (customers at start − customers at end) ÷ customers at start × 100%.
Renewal rate is the flip side and shows how well you keep existing customers over time.
Measure both consistently so your teams spot retention risks early and prioritize save plays.
Net revenue retention: expansion, downgrades, and churn
NRR = (revenue at start + expansion − churned) ÷ revenue at start × 100%. This captures expansion and losses together.
Compare examples: Company A at 80% NRR shrinks without new business, while Company B at 140% NRR grows from upsells and low churn.
CSAT and NPS as leading indicators of value and loyalty
CSAT = satisfied respondents ÷ total respondents × 100%. NPS = % promoters − % detractors.
Use these surveys as early warnings. Drops in CSAT or NPS should trigger immediate outreach to save revenue and improve experience.
Adoption rates to validate product value in use
Track usage milestones and time-to-value so you know customers realize product value before renewal decisions arrive.
Analyze by segment, product, and cohort. Align sales and customer success on expansion plays to turn satisfaction into repeat purchases and predictable growth.
“Set thresholds for proactive outreach based on adoption, survey trends, and time-to-value so teams act before churn becomes revenue loss.”
- Standardize definitions so reporting is crisp.
- Run weekly reviews of leading indicators and assign owners.
- Feed product and marketing with feedback to fix root causes of churn.
Operations and systems: data quality, utilization, and tech observability
Reliable systems and clean data let your teams act fast, not guess. Treat operations as the plumbing that keeps revenue flowing. When tools are adopted and integrations are healthy, sales, marketing, and success can move with confidence.
Technology utilization and internal adoption rates
Measure tool adoption and utilization so you spot underused apps early. Low adoption often means missing training, confusing workflows, or duplicate tools that drain budget.
Track active users, feature adoption, and time-to-first-success to decide where to train, consolidate, or retire systems.
System performance and integration health
Monitor uptime, response time, integration efficiency, and error rates. Small outages or sync failures create reporting gaps that ripple into poor decisions.
- Log integration errors and fix them within a defined SLA.
- Run periodic end-to-end tests so handoffs between systems remain audit-ready.
- Favor reliable connectors over brittle point-to-point hacks.
Data quality as the backbone of accurate decisions
You’ll treat data quality as non-negotiable: assign ownership, validate fields, and build quick defect workflows. Clean data makes your dashboards trustworthy and your leadership updates painless.
“Map required fields, set role-based dashboards, and connect operational health to revenue outcomes so the whole organization sees the value.”
- Define core fields needed for your revenue reporting and enforce them at capture.
- Set role-based views so each team sees actionable insights without noise.
- Document SLAs and escalation paths so system issues don’t delay quarter-end reports.
Instrument your RevOps: dashboards, cadences, and decisions
Make visibility the engine of action. Build a small set of role-based dashboards and a short review rhythm so your organization moves from data to decisions fast.
Real-time KPI dashboards for shared visibility
Give every role the view they need. Executives see confidence levels, managers get drill-downs, and front-line reps get tasks tied to goals.
- Keep dashboards minimal — 3–5 cards per view to reduce noise.
- Tie each card to a goal and an owner so action is obvious.
- Use visual alerts for threshold breaches so teams act in time.
Weekly reviews and adaptive metrics as your market shifts
Run a short, structured weekly review that surfaces trends, errors, and next steps. Record owners, due dates, and the expected outcome.
When the market moves — say from acquisition to retention — adjust metric weights and targets so the sales and marketing teams stay aligned.
- Streamlined pipeline view: conversion, coverage, and velocity.
- Calibrate forecast confidence and document assumptions for leadership.
- Close the loop by reviewing outcomes against prior decisions and updating playbooks.
“Visibility, a crisp cadence, and clear owners turn numbers into reliable revenue actions.”
Conclusion
Turn these numbers into action by naming owners, setting clear thresholds, and running brief weekly reviews. When you tie dashboards to playbooks you make revops metrics and revenue operations visible and useful across the company.
Start with ARR/MRR and net revenue, then add leading signals like weighted pipeline, sales velocity, and conversion. That mix gives your sales and marketing teams the early warnings they need to protect recurring revenue and sustain growth.
Guard lifetime value with timely customer success plays—track churn, CSAT, NPS, and adoption so you can save and expand accounts. Clean data and dependable systems make your dashboard trustworthy and your leadership updates credible.
Next step: align owners, finalize definitions, and launch the dashboard and review cadence. Use this guide as your playbook to instrument, measure, and scale predictable revenue growth fast.