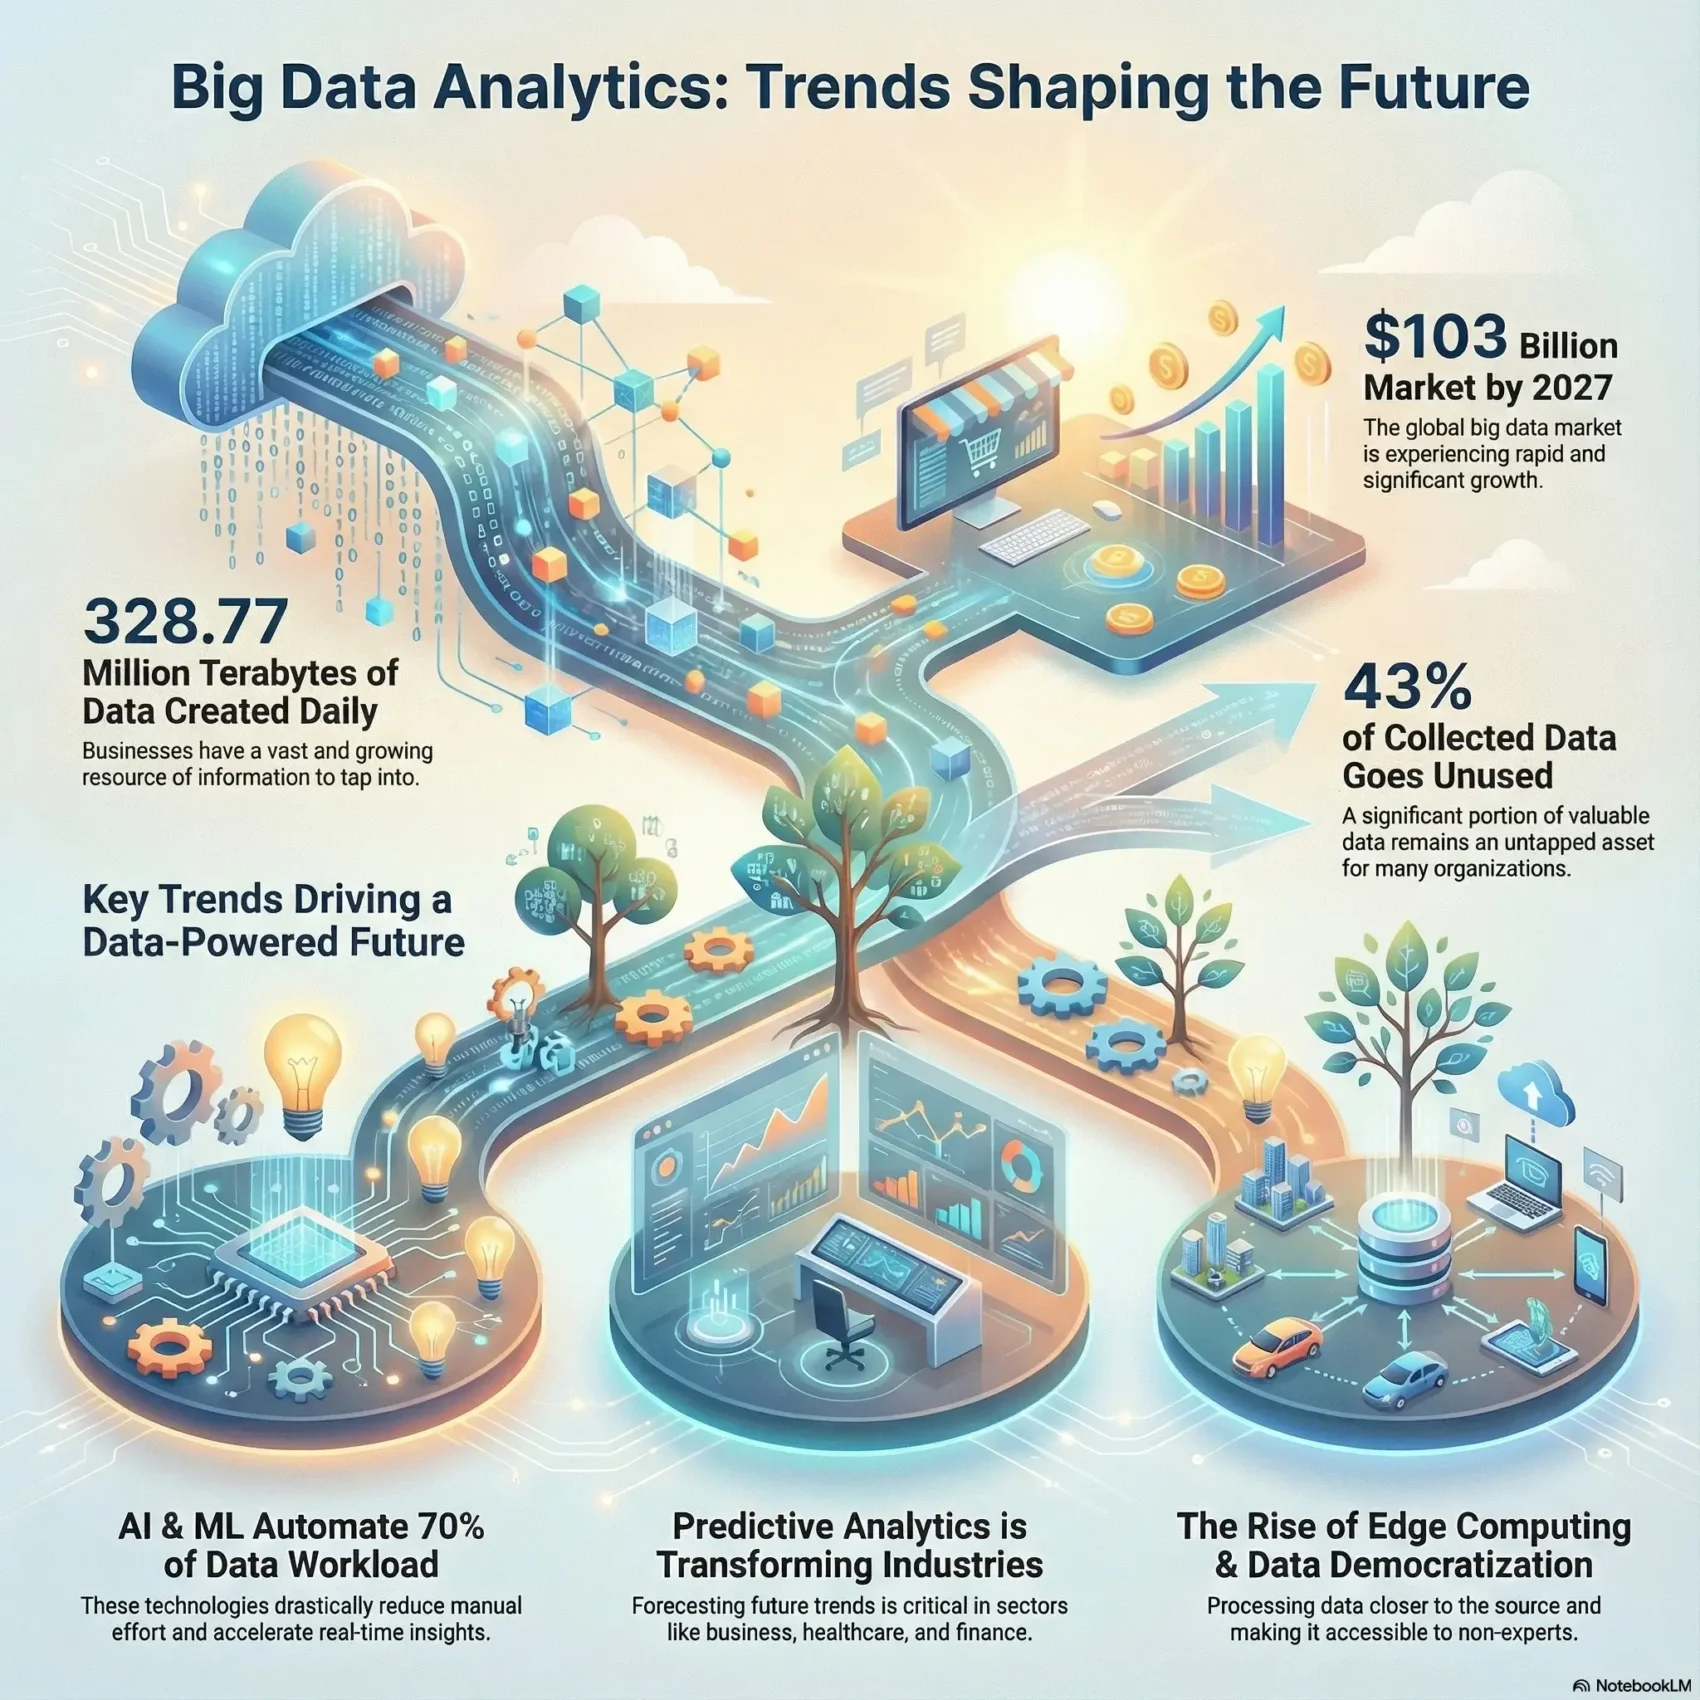
Every company now sits on more data than it can read. Roughly 181 zettabytes of data were created worldwide in 2025, and the figure is expected to reach about 221 zettabytes in 2026 (Statista). A zettabyte is a trillion gigabytes, so the number stops meaning much on its own. What matters is the practical consequence: the useful signal in your sales, support and product data is buried under far more noise than any team can read manually.
That is the job big data analytics does. It is the set of tools and methods that pull patterns out of datasets too large or too messy for a spreadsheet. The market for it reached an estimated $394.7 billion in 2025 and is projected at $447.7 billion in 2026, growing at about 12.8% a year (Fortune Business Insights). This guide covers what has actually changed by 2026, which big data trends are worth your budget, and where the money keeps getting wasted. It stays with the data layer itself: volume, pipelines, devices and governance. For how forecasting, AI agents and decision support are reshaping analytics work as a whole, see our guide to the future of business analytics.
Key Takeaways
- Data volume keeps climbing, but volume alone creates no value. Usable, well governed data does.
- The big data analytics market is projected at roughly $448 billion in 2026.
- AI speeds up analysis, yet most generative AI projects still show no measurable return.
- Predictive analytics is the clearest source of payback, especially in forecasting and healthcare.
- Governance is no longer optional. The EU AI Act became fully applicable on 2 August 2026.
What Big Data Analytics Actually Means
Big data analytics means examining very large or fast moving datasets to find patterns a person would miss. The classic shorthand is the four Vs: volume (how much data), velocity (how fast it arrives), variety (how many different formats) and veracity (how reliable it is). A single online shop hits all four. It collects clicks, payments, returns, chat transcripts and delivery scans, all at once, all in different shapes.
Traditional reporting answers what happened last quarter. Big data analytics goes further and answers why it happened, and what is likely to happen next. In practice that means a retailer spotting which product pages lose buyers at checkout, or a logistics firm seeing which routes slip before the delay reaches the customer.
The work sits on three layers. Storage holds the raw material, often in a data lake that keeps files in their original format. Processing cleans and joins it. Analysis turns it into something a human can act on, usually through a business intelligence tool that builds dashboards and reports.
Cloud platforms made all of this affordable. You rent storage and computing power for the hours you use them instead of buying servers. That single shift is why a 30 person company can now run analyses that needed a corporate IT department fifteen years ago.
How Much Data Businesses Now Handle
The growth in data is real, but it is easy to draw the wrong conclusion from it. More data does not automatically mean better decisions. It usually means more storage cost, more duplication and more places for an error to hide.
The Volume Problem
Most of what companies collect is never analysed. Logs, backups, old exports and abandoned reports pile up quietly. The honest question is not how much data you hold, but how much of it you can trace, trust and actually use.
Gartner puts the average annual cost of poor data quality at a minimum of $12.9 million per organisation, based on its 2020 research. The costs are rarely dramatic. They show up as marketing budget spent on wrong addresses, forecasts built on duplicate records, and analysts spending their week reconciling two systems that disagree.
The practical response is to narrow the scope. Pick the handful of datasets that drive real decisions, such as orders, customers and inventory, and get those clean first. Broad data cleanup programmes tend to stall. Focused ones tend to finish.
What the Market Is Worth
Spending keeps growing across the sector. Alongside the $447.7 billion big data analytics market in 2026, the predictive analytics segment is projected at $27.6 billion in 2026, up from $22.2 billion in 2025 (Fortune Business Insights). Edge computing, which means processing data close to where it is produced, is projected at $25.6 billion in 2026.
Four forces sit behind those numbers:
- AI and machine learning built directly into analytics tools, so a question can be typed in plain language instead of written as code.
- Edge computing, which cuts the delay caused by sending everything to a distant data centre.
- Natural language processing, which makes unstructured material such as emails, reviews and support tickets analysable.
- Cloud native platforms, which scale up for a heavy month and back down again.
Recognising and adapting to these Big Data growth trends helps you plan where the next round of investment belongs. If you want a structured way to judge where your own company stands, an analytics maturity model gives you a stage by stage benchmark.
Where AI and Machine Learning Fit
Artificial intelligence changed how quickly analysis can be produced, not whether the underlying data is any good. It is an accelerator, and it accelerates bad inputs just as efficiently as good ones.
Real-Time Analytics in Practice
Real-time analytics means acting on data within seconds of it arriving rather than reviewing it next week. A payment provider blocking a suspicious transaction mid-checkout is real-time analytics. So is a warehouse system that reroutes a picker because a shelf just emptied.
Machine learning models handle the pattern matching underneath. They learn from historical examples, then score new events as they come in. The heavy lifting is not the model. It is the plumbing that gets clean data to the model fast enough to matter, which is why real-time data pipelines get so much attention.
Gartner expects adoption of agentic data streaming, where AI agents manage those live data flows themselves, to pass 60% by 2028, up from under 15% in 2025. That is a forecast rather than a measurement, so treat it as a direction of travel.
Why Most AI Projects Still Fail
The gap between AI ambition and AI results is the defining fact of 2026. MIT’s NANDA initiative reported in its State of AI in Business 2025 study that around 95% of enterprise generative AI pilots produced no measurable return on the profit and loss statement.
The reasons are consistent and unglamorous. The data feeding the model is inconsistent. Nobody owns the process the tool was meant to improve. The pilot was never tied to a number anyone tracks. Tools that succeed are usually narrow: one team, one workflow, one measurable outcome.
If you are choosing where to start, look for a decision that is made often, follows clear rules, and currently costs someone hours each week. That is also where augmented analytics, meaning AI assisted exploration of your own data, tends to earn its licence fee first.
Data From Connected Devices
Connected devices, usually called the Internet of Things or IoT, are sensors and machines that send readings back over a network. A temperature probe in a cold store, a fuel meter in a truck and a vibration sensor on a pump are all IoT devices. They generate a constant stream rather than an occasional file.
That stream is valuable in specific, unglamorous ways:
- Machines report a fault developing before they break, which turns an emergency repair into a scheduled one.
- Stock and asset locations stay current without anyone walking the floor with a clipboard.
- Forecasts improve because they use measured conditions instead of assumptions.
- Customers get accurate delivery and service updates rather than optimistic estimates.
The effect shows up across sectors. In manufacturing, live monitoring of machinery lifts uptime. Smart cities improve services such as traffic control and energy distribution. In healthcare, connected monitors let staff react to a patient’s decline sooner. For a wider view of the commercial side, see how IoT is changing everyday business operations.
One warning worth taking seriously: every sensor is also an entry point. Device security and network segmentation belong in the project plan from the start, not after the first incident.
Predictive Analytics and Where It Pays Off
Predictive analytics uses historical data and statistics to estimate what is likely to happen next. It does not tell you the future. It gives you a probability, with a margin of error, which is far more useful than a guess.
Forecasting in Business
Forecasting is where large datasets pay back most reliably, because models learn from patterns that repeat across past orders, customers and conditions. The barrier is rarely the technology, since the major cloud platforms bundle forecasting models with storage. It is having enough clean history to learn from: two years of reliable orders beat ten years of records nobody trusts. Our deeper look at how predictive analytics is changing business decisions in 2026 covers model types and implementation.
Applications in Healthcare
Healthcare is where the case is easiest to see. Analysing patient records helps identify people at high risk of readmission, tailor treatment plans, and plan staffing around expected demand. Insurers use the same techniques to flag suspicious claims.
The caveat matters. Models trained on one population can perform badly on another, and a wrong prediction about a patient is not a rounding error. Clinical use needs human review and regular re-testing, which is exactly what regulators now expect.
Making Data Readable
A finding nobody understands changes nothing. Data visualization turns numbers into a picture a decision maker can read in seconds. Tools such as Tableau, Power BI and Looker Studio do the drawing, but the choice of chart is a judgement call.
The common formats each answer a different question:
- Bar charts compare categories.
- Line charts show change over time.
- Scatter plots reveal whether two variables move together.
- Heat maps highlight concentration, such as where support tickets cluster.
- Maps show geographic patterns, which is the core of geospatial analytics.
The mistake to avoid is decoration. A dashboard with twenty charts and no headline forces every viewer to work out the point themselves, and most will not. Lead with the one number that changed and explain why. That discipline is the heart of data storytelling, which is presenting findings as a clear narrative.
Data Management Challenges and Solutions
Data management is where analytics projects quietly succeed or fail. As volumes rise, keeping information accurate, findable and usable becomes harder, and no visualisation can rescue an unreliable number.
Addressing Data Quality and Accuracy
High data quality is the precondition for everything else. Four measures do most of the work:
- Set clear ownership: name one person accountable for each important dataset. Shared responsibility usually means none.
- Automate monitoring: alerts that fire when a field goes empty or a total jumps catch errors before a report does.
- Invest in training: most bad data enters through a form someone filled in without knowing what it feeds.
- Standardise definitions: agree what counts as an active customer once, in writing, and use it everywhere.

None of this is exciting work, which is why it gets skipped. It is also the difference between a dashboard people act on and one they quietly stop opening.
The Trends Shaping 2026
Three shifts define the current year: analysis moving closer to where data is created, tools moving into the hands of non-specialists, and AI agents taking over parts of the pipeline itself.
Edge Computing Moves Analysis Closer to the Source
Edge computing processes data on or near the device that produced it rather than shipping everything to a central cloud. The benefit is speed and lower bandwidth cost. A camera that identifies a defect on the production line locally does not need to send video anywhere.
The market is projected at $25.6 billion in 2026 and forecast to grow at about 34% a year through 2034 (Fortune Business Insights). Growth that fast usually means the category is still being defined, so judge vendors on your own use case rather than the headline number. See our overview of what edge computing changes at work, and of edge AI, which runs the model itself on local hardware.
Data Democratization and Self-Service Analytics
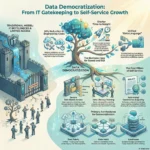
Data democratization means giving ordinary staff safe access to data without routing every question through an analyst. Natural language interfaces made this realistic: a manager can now type a question and get a chart back.
The risk is obvious. Wider access without agreed definitions produces five versions of the same number in one meeting. The fix is a shared semantic layer, which is a single place where terms such as revenue and active user are defined for every tool. Gartner expects these layers to become standard infrastructure by 2030. Our guide to self-service analytics covers the rollout in detail, and the same data often opens new revenue lines, as our piece on data monetization in 2026 explains.
AI Agents Enter the Pipeline
The newest shift is agentic data management, where AI agents monitor pipelines, spot anomalies and fix routine breakages without being asked. Gartner named it a top data and analytics trend for 2026, alongside decision governance and GraphRAG, a technique that grounds language model answers in a structured knowledge graph to reduce invented facts.
This is early. The sensible position is to pilot agents on low risk maintenance tasks, keep a human approving anything that changes data, and log every action. What these tools cannot do is invent trust in numbers that were never reliable. For the longer arc, our look at where business analytics is heading beyond 2026 puts these shifts in context, and big data in customer experience shows where the payoff has been clearest.
Why Data Governance Decides the Outcome
Data governance is the set of rules covering who may use which data, for what, and under which safeguards. It sounds like paperwork. In 2026 it is closer to a licence to operate.
The EU AI Act became fully applicable on 2 August 2026. Providers of high-risk AI systems must maintain a documented risk management system, data governance measures, technical documentation, automatic logging and human oversight. Deployers must follow the provider’s instructions, monitor performance and report serious incidents. Separate transparency duties require telling people when they are interacting with an AI system and labelling AI-generated content in a machine readable way. Our summary of what the new AI rules mean for businesses breaks down who is affected.
A workable governance programme covers four things:
- Quality: data is accurate, current and defined the same way everywhere.
- Accountability: named owners for each dataset and each model in production.
- Compliance: documented lawful basis for processing, retention limits and audit trails.
- Security: access controls, encryption and logging that would survive an inspection.
Gartner predicts that by 2030 half of organisations will use autonomous AI agents to translate governance policies into machine-verifiable data contracts. Until then the work is human. Our data governance strategy guide sets out how to build the framework, and data privacy trends for 2026 covers the regulatory side in more depth.
What to Do Next
The useful lesson from 2026 is that the constraint has moved. It is no longer computing power or storage cost, both of which are cheap and rentable. It is data you can trust and a decision worth improving.
So start narrow. Pick one recurring decision, identify the two or three datasets it depends on, clean those, and measure whether the decision improves. That approach is slower to announce and far more likely to survive contact with a budget review than a platform-wide programme.
The companies getting value from big data analytics in 2026 are rarely the ones with the most data. They are the ones who know which data matters, who owns it, and what they will do differently once they have the answer.
Found this useful?
Make SmartKeys a preferred source on Google, and our articles will surface more often in your Top Stories, AI Overviews, and AI Mode.
Add as Preferred Source