Last Updated on February 18, 2026
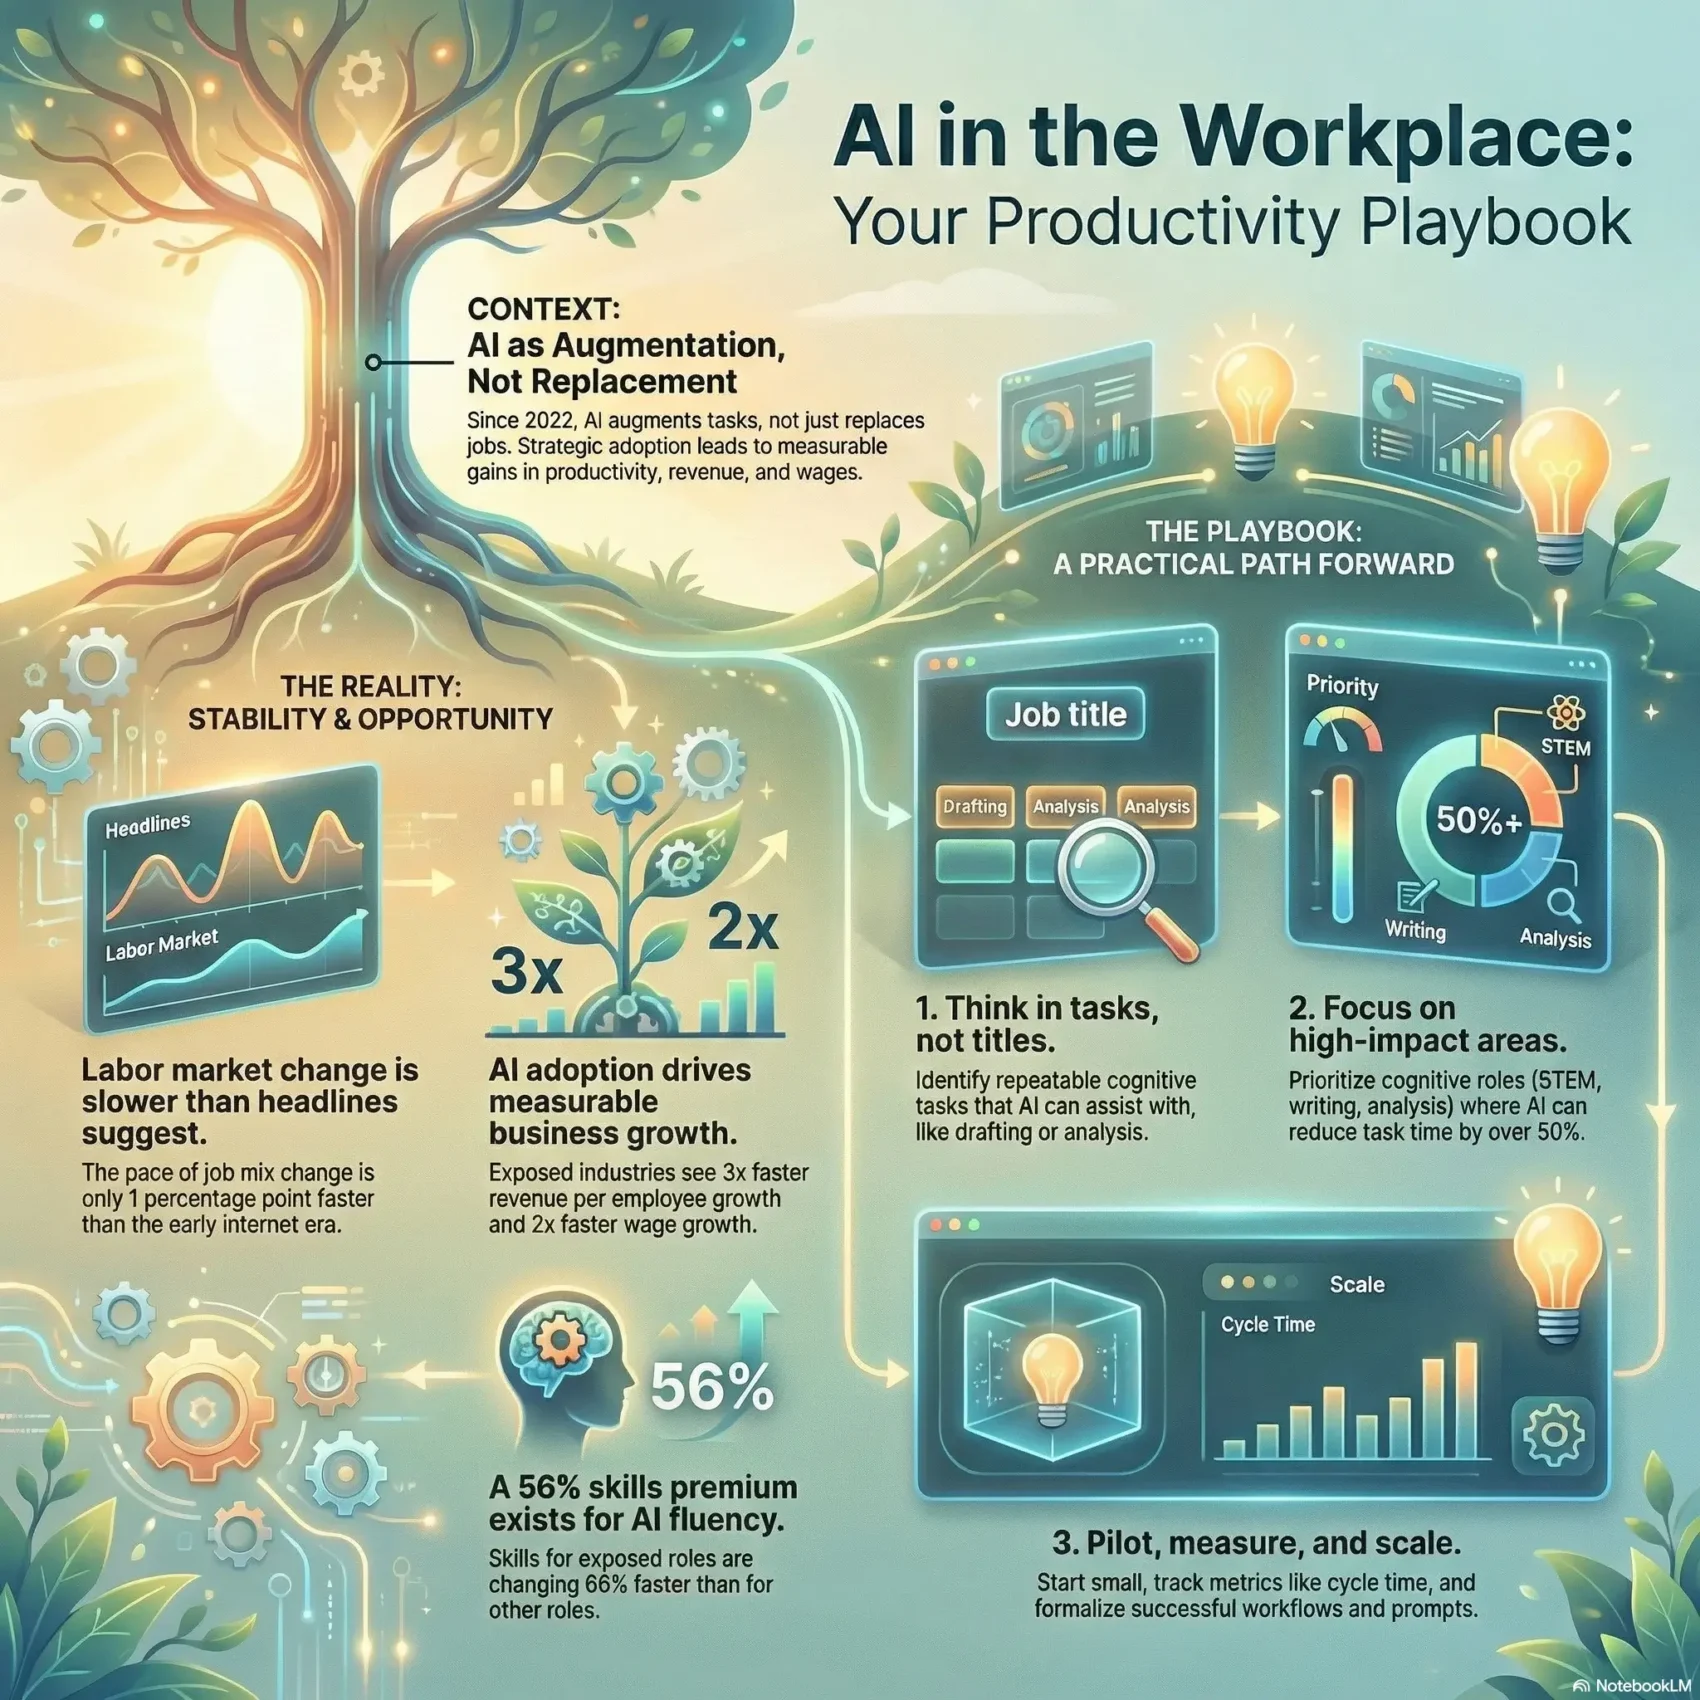
You face a clear choice: use emerging tools to boost your performance now, or wait and react later. Recent analysis since ChatGPT’s 2022 launch shows little economy-wide shift in occupations over 33 months. Still, firms that adopted generative platforms saw faster revenue per employee and quicker wage growth, per PwC.
That mix matters. Brookings estimates many workers could see large task disruption, especially in middle-to-high wage cognitive roles. The immediate impact has been on productivity and value creation rather than mass layoffs.
This guide gives a practical roadmap based on real data, not hype. You’ll learn what to automate, what to keep human, and how to measure impact. It explains how technology is changing work today and where trends point for the future.
Key Takeaways
- Use current evidence to prioritize augmenting workers for measurable gains.
- PWC data shows higher revenue per employee in technology-ready industries.
- Brookings highlights task disruption concentrated in cognitive roles.
- Focus on automating repeatable tasks and protecting high-value human judgment.
- Measure results, manage risks, and align tools with team purpose.
Why this matters to you today: the state of AI and work in the recent past
Data from the past 33 months reveal steady change rather than sudden upheaval. Analyses comparing November 2022 through mid‑2025 to earlier tech waves show the occupational mix shifted at a pace similar to past periods — roughly one percentage point faster than the early internet era but not a dramatic break.
You’ve seen the concerns in headlines, yet the broader economy has stayed stable. Volatility remains low compared with mid‑20th century rebounds. Pre‑trends from 2021 suggest some shifts began before ChatGPT’s launch, so causation is complex.
What this means for you: workers aren’t being displaced at scale today. Early‑career workers show mild divergence from older cohorts, but sample sizes are small and a slowing labor market could explain some of that signal.
“Focus on where tools deliver immediate value; you have time to upskill and redesign work.”
- Over the last year and prior years the pace of occupational change stayed within historical bounds.
- Adoption is fast, but jobs haven’t rapidly vanished, per current analysis.
- Use this breathing room to invest in skills and practical augmentation where it saves time today.
Defining the difference: augmentation, automation, and the jobs-tasks spectrum
Think in tasks, not titles — that’s where real efficiency shows up. Break work into discrete activities and you can see which parts a model can handle and which need a human touch.
How tasks, not entire jobs, determine impact
How tasks, not entire jobs, determine impact
OpenAI’s exposure metric measures whether GPT‑4 and related software could reduce time complete for a task by 50% or more. It then aggregates that data up to an occupation level score.
More than 30% of workers could see at least half of their occupation’s tasks disrupted. The effects cluster in cognitive, nonroutine activities like programming, writing, and analysis.
Where models help you cut cycle time
Where models help you reduce time to complete work by 50%+
Use tools such as GPT‑4, Claude, Gemini, and Copilot to pilot repeatable cognitive tasks. Start with activities that have clear inputs and outputs and high reviewability.
- Map tasks to exposure level and sequence pilots from low-risk to high-impact.
- Separate augmentation (you stay in the loop) from automation (end-to-end performance).
- Prioritize measurable cycle times so you can verify time savings and reallocate effort.
“Map tasks first; the same job title can mean very different exposure across teams and sector.”
What changed—and what didn’t—since ChatGPT’s launch
Since late 2022 the labor market has shifted, but not in the sudden way many headlines implied. The dissimilarity index for occupational mix sits only about one percentage point higher than the early‑internet period, so the overall pace of change looks familiar.
Labor market mix stability mirrors past tech waves
Careful data analysis shows patterns that began before the launch. Changes in 2021 point to longer trends, not a single‑year reset.
Pre-ChatGPT trends vs. post-launch narratives
Some sectors moved faster—Information leads, followed by Financial Activities and Professional/Business Services. That matches historic sector dynamics rather than a unique event tied to one platform.
“Track team-level signals and measure gains; near-term workflow wins matter more than panic.”
- Despite an explosive debut, the labor market didn’t pivot overnight.
- Directional data were visible in prior years, so claims of immediate economy-wide disruption overstate the case.
- For your plans, phase capabilities in over multiple years and use dashboards to compare team changes to sector norms.
Want a practical path to adapt? See a concise adaptation guide that walks you through measured rollout and yearly planning.
AI job augmentation: your core opportunity in this cycle
Practical pairing of workers and technology is the fastest route to measurable improvement. PwC data shows revenue per employee rose faster in exposed industries since 2022, and wages climbed faster too. That combination signals real business value alongside pay growth.
Start small and measurable. Pilot where you can reduce cycle time, lift quality, and shift people into higher-value work. Focus on client deliverables, coding, analysis, documentation, and knowledge retrieval.
- Align pilots to core values like accuracy, privacy, explainability, and trust to win buy-in from companies and customers.
- Prioritize tasks with clear “reduce time complete” upside and low external risk to build momentum.
- Translate time saved into faster throughput, more iterations, and better service levels so the impact is visible.
“Pairing people with tools delivers measurable gains while preserving human judgment on edge cases.”
Formalize role redesign and foster a learning culture where your teams share prompts and templates. For a practical starting roadmap, see the AI assistants guide.
Exposure vs. usage: why “risk” models and real tools don’t always match
Exposure scores tell a story, but real usage often writes a different chapter. OpenAI’s exposure metric rates whether GPT‑4 could cut task time by 50% or more and then aggregates that up to an occupation level. That gives a useful prioritization hint, not a deployment plan.
OpenAI exposure quintiles and the stability of worker share
Worker share by exposure quintile has stayed steady since launch: roughly 29% low, 46% middle, and 18% high. That stability moderates immediate risk assumptions.
Anthropic usage trends: coding and content skew
Usage telemetry from Claude shows heavy concentration in computer/math and arts/media roles. In practice, tools are used most for code and writing tasks, and diffusion across industries remains uneven.
Bridging the gap: enterprise adoption, APIs, and measurement limits
Exposure and usage correlation is low. You should treat your own telemetry—API logs, enterprise controls, and per-task cycle time—as ground truth.
“Use exposure to prioritize pilots, then measure real outcomes before scaling.”
- Validate exposure with on-the-ground analysis of workers and tasks.
- Run cross-model pilots and track cycle time, quality, and error rates.
- Build governance that spans models so companies can swap or blend tools as needs change.
Productivity and value creation trends in AI-exposed industries
Where teams wrap model outputs with software and tests, you’ll notice a clear uptick in throughput and revenue per head.
PwC data show that the most exposed industries have seen revenue per employee grow roughly three times faster since 2022. Overall revenue in those sectors rose nearly fourfold in the same period.
Revenue per employee acceleration since 2022
That acceleration is real and measurable. Firms with strong digital foundations converted model capabilities into sustained business results.
When workers use software to stitch outputs into products, cycle times fall and throughput rises.
From model to results: where software and code drive gains
Gains cluster in engineering, data, and content-heavy functions. Code-level automation — scaffolding, test generation, and debugging — helps teams ship more features with fewer defects.
- Data-informed teams embed models into apps to reduce handoffs and shorten feedback loops.
- Demand is strongest where product cycles are fast and measurement is tight.
- You can model ROI by tracking artifacts per worker and cycle-time improvements.
“Standardize prompts and review stages, then automate checks with tooling to lock in reliable results.”
In short, industry context matters. Regulated sectors move slower but can unlock high-value pockets with careful design. Use these trends to justify targeted investments tied to concrete productivity metrics.
Wage dynamics: how AI skills are changing pay
Earnings are rising in places where workers turn new capabilities into clear impact. PwC found that wages grew roughly twice as fast in the most exposed industries compared with the least exposed. The same report shows a 56% skills premium for workers who demonstrate relevant model fluency versus peers in the same occupation.
Wages rising faster in exposed sectors
Growth concentrates in industries that adopt tools and embed them into workflows. At the sector level, firms that tie skills to measurable outcomes pay more. That trend shows up across seniority level bands and in multiple functions, not only in tech roles.
The 56% skills premium and what it means for your career
You can translate fluency into higher pay by linking your work to revenue, quality, or cycle-time gains. Build demonstrable skills—workflow design, prompt craft, evaluation, and data handling—and show impact.
- Translate skills into results: attach metrics to your contributions.
- Choose sector-fit: pick certifications and projects that match industry demand and compliance.
- Keep experiments frequent: small, regular projects keep your skills current and marketable.
“Every industry analyzed pays a premium for these skills.”
The skills earthquake: how job requirements are shifting
Skills are shifting under your feet as technical fluency rises across roles. PwC finds that skills for exposed roles are changing 66% faster than for others. That pace of change means you must map learning to actual tasks and outcomes.
Skills for exposed roles changing faster
Nonroutine cognitive tasks—programming, writing, and analysis—show the most movement, per Brookings. You need concise skill plans that link to daily activities and clear wins.
Practical skill paths you can follow
- Target prompt patterns, retrieval-augmented workflows, and solid documentation that match real tasks.
- Learn to orchestrate multiple tools and spreadsheet or BI flows so your work integrates across functions.
- Build a learning plan from basic prompting to structured pipelines with templates, checklists, and guardrails.
- Assess model behavior, measure quality, and iterate based on failure modes you encounter.
- Track sector and industries trends to pick certifications and projects that hiring managers value.
“Adoption sticks when new skills tie to faster drafting, cleaner analysis, and clearer client outputs.”
Who’s most exposed today? Middle-to-high wage cognitive occupations
The clearest signals point to knowledge professions—STEM, law, business, and media—where task structure raises exposure. Brookings analysis of OpenAI data shows higher exposure for middle-to-high wage cognitive occupations and for clerical and office tasks that are documentable and reviewable.
- STEM, business/finance, law, architecture/engineering, and media roles show higher task-level risk but also large upside when tools improve cycle time.
- Clerical and office activities are especially exposed because many processes are standardized and easy to audit.
- Blue-collar fields that require manual, on-site work face lower near-term exposure from disembodied technology.
- Service roles vary: customer-contact tasks may be augmented, while in-person services remain more resilient.
Share of workers in high-exposure buckets has stayed fairly stable, so you have time to upskill strategically. Monitor your occupation’s exposure signals, add quality checks and human-in-the-loop safeguards, and use first-pass drafting or analysis tools to free time for expert judgment.
“Use exposure maps to target learning, not to panic.”
Industry snapshots: where augmentation is gaining ground
Different industries move at different speeds; your sector’s rules shape where you start. Use pilots tied to clear KPIs so you can scale what works and stop what doesn’t.
Financial Services
Front and back office teams augment due diligence, customer service, and reporting while keeping tight controls in regulated settings.
Healthcare
Healthcare groups run risk-controlled pilots for documentation and triage to ease worker shortages. Strong governance protects privacy and accuracy.
Public sector
Public employers reshape roles to speed case processing and citizen services without adding headcount. Templates and QA routines are key.
ICT and Professional Services
Companies in software, data, and consulting turn repeatable knowledge work into products. That drives faster delivery and clearer outcomes for clients and workers.
Wholesale and Retail
Retailers focus on reskilling front-line teams to lift customer interactions and inventory accuracy. Playbooks and shared learnings spread best practices across offices.
- Across sectors: adoption depends on compliance, data readiness, and legacy systems.
- Measure to scale: align pilots to service levels, error rates, and throughput.
- Share learnings: standardized prompts, templates, and QA free experts for complex cases.
“Scale only what proves out against core KPIs.”
Early-career workers, inequality, and worker voice
If you graduated recently, you may see mild hiring headwinds that mix labor-market softness with new technology expectations. Small cohort shifts since 2021 suggest slight dissimilarity between recent grads and older peers, but sample sizes are limited. Use the breathing room to build practical fluency and document measurable results.
Early-career exposure signals and labor market softness
Analyses show slight increases in cohort dissimilarity for 20–24 versus 25–34 year olds since 2021. That trend may reflect a softer hiring market this year as much as changing task mixes.
Small exposure signals are a cue, not a verdict: track outcomes you can quantify so promotions and offers reflect real contribution.
Why unions, bargaining, and worker input matter for deployment
Worker voice reduces unintended harm. Involving you in pilot design improves adoption and reduces concerns about surveillance, unfair evaluation, and unequal access to learning.
- Unions and collective bargaining can lock in guardrails on data use and evaluation criteria.
- Capture data on workloads and learning so access to tools is equitable.
- Clear communication on role changes and training eases transitions and limits turnover risk.
- Sector differences matter: public sector and healthcare often move slower but can formalize worker input effectively.
“Worker input helps shape deployment and mitigate risks like job loss, surveillance, and inequality.”
Designing augmentation, not displacement: strategies for employer-deployers
Begin with a people-first plan that maps tasks to business outcomes and clear safeguards. Map what teams actually do, then pick augmentable tasks that free workers for higher-value work. That approach helps companies capture gains without sacrificing quality or trust.
Task mapping: identify augmentable activities across roles
Break down roles into discrete tasks and rank them by repeatability, auditability, and impact. Focus on activities that save time and feed clear metrics like throughput or revenue per employee.
Pilots and guardrails: accuracy, privacy, bias, and human-in-the-loop
Design pilots with explicit thresholds for accuracy and privacy. Add bias testing and human-in-the-loop checkpoints so workers remain the final arbiter on sensitive decisions.
Reskilling at scale: building skills pathways with measurable outcomes
Offer role-aligned training tied to assessments and artifacts. Use practical projects to prove learning and translate new skills into higher pay and career movement, as PwC data suggests.
Value tracking: time saved, error rates, and revenue per employee
Track consistent metrics—time saved, error reductions, throughput, and revenue per employee. That analysis closes the gap between exposure scores and real usage outcomes.
- Align tools and workflows to your values: transparency, accountability, and fairness.
- Sequence rollouts by sector complexity to manage risk and capture upside.
- Incorporate worker feedback loops to refine prompts, templates, and SOPs.
- Define decision rights so people know when to rely on tools, when to review, and when to escalate.
- Connect pilots to compliance and security from the start and publish internal case studies to spread learnings.
“Design systems that raise productivity while protecting worker voice and standards.”
Your playbook: how to future-proof your role with AI tools
Start by choosing two or three repeatable ways to show quick wins. Pick tasks that cause friction and that you can measure. This helps you build credibility with real results.
Embed assistance into daily workflows to reduce cycle time
Use simple templates and integrate tools inside Docs, IDEs, or your CRM so your daily work stays familiar.
Focus first on reducing time complete for a small set of tasks. That yields faster feedback and clearer metrics.
Showcase measurable impact: throughput, quality, client value
Track before-and-after metrics—throughput, defect rates, and client satisfaction. Convert time saved into demonstrable results that tie to pay and promotion.
- Start with two high-friction tasks and build prompt templates that cut cycle time.
- Apply assistance to code scaffolds, tests, and refactors; use it for outlines and drafts in writing.
- Keep activities reviewable and log what you approved or edited for audits.
- Share your playbook so coworkers adopt what works and practices converge.
- Version prompts and revisit workflows quarterly to keep improvements aligned with your jobs goals.
“Build a small portfolio of artifacts showing measurable impact to strengthen your growth case.”
Measuring impact with better data: from exposure scores to real usage
To understand real impact, you need measurement that links daily work to clear business metrics. Exposure scores are a starting point, but they are theoretical and often miss how people actually use tools in workflows.
Limits of current models and why comprehensive usage data is essential
OpenAI’s exposure metric estimates potential task disruption, not actual adoption. Anthropic’s Claude shows heavy use in coding and writing, which skews industry signals.
That weak correlation means you should collect privacy-protected enterprise and API usage logs to validate impact at the team level.
Cross-model monitoring: Claude, ChatGPT, Gemini, and Copilot
Set up cross-model telemetry so you can compare performance and adoption across Claude, ChatGPT, Gemini, and Copilot. Define schemas for task type, difficulty, review effort, and error classes.
- Track users, sessions, and artifacts to measure share and adoption.
- Capture software and code integrations where automation effects live.
- Tie usage to KPIs—cycle time, quality, and revenue per employee—for clear analysis.
“Measure what people actually use, then let the data guide investment decisions.”
Risk management: addressing bias, surveillance, and job quality
Good governance starts with simple, enforceable limits that protect workers while letting teams deliver. Build rules that make clear what is allowed and what is not. That keeps tools from becoming tools of harm.
Balancing productivity with worker rights and autonomy
You should design controls that address core issues—bias, privacy, surveillance—without stalling productive work. Involve frontline staff in pilots so concerns surface early and fixes follow fast.
Collective bargaining has already set useful precedents. Use those examples to create escalation paths, transparent feedback channels, and limits on intrusive monitoring.
Policy levers and corporate codes of conduct for responsible use
Adopt a purpose-driven code that defines acceptable use cases and red lines for your company. Align procurement, vendor rules, and internal policies with labor law and sector rules so adoption meets both legal and ethical tests.
- Design controls that catch bias and drift and document reviews for audits.
- Limit monitoring to outcomes, not keystrokes, to preserve autonomy and trust.
- Partner with employee groups to co-create guidelines and safe escalation paths.
- Train managers on fair evaluation when tools affect performance conversations.
“Responsible deployment requires codes of conduct, worker engagement, and policy alignment.”
Conclusion
You can turn measured experiments into lasting gains for your team and industry. National data show stability in occupational mix since the launch, while PwC reports faster revenue per employee and rising wages in exposed sectors.
Focus on task-level wins that deliver clear impact. Speed, quality, and client trust are the ways you translate small wins into durable results for the economy and your workplace.
Prepare for future change by investing in skills, measurement, and governance. Treat worker voice and policy as enablers, not hurdles, and evaluate each new model with pilots and strict metrics.
With disciplined execution and purpose at the center, you can shape a future that benefits workers, firms, and the wider world.