Automation changes who does which task at work, and that quietly decides who gets paid. This guide explains how that plays out in the United States, what the research actually shows, and what you can do about it.
New technology has raised output per person for two centuries, from the steam engine to today’s AI models. Those gains do not spread evenly. Since 1980, real pay for workers without a high school degree has fallen, even as output per hour kept climbing.
You will get a short roadmap here: what the evidence says about wages, why market structure matters, and practical steps to protect your income. The point is not alarm. It is to help you position your skills so that productivity gains reach more people and more places.
Key Takeaways
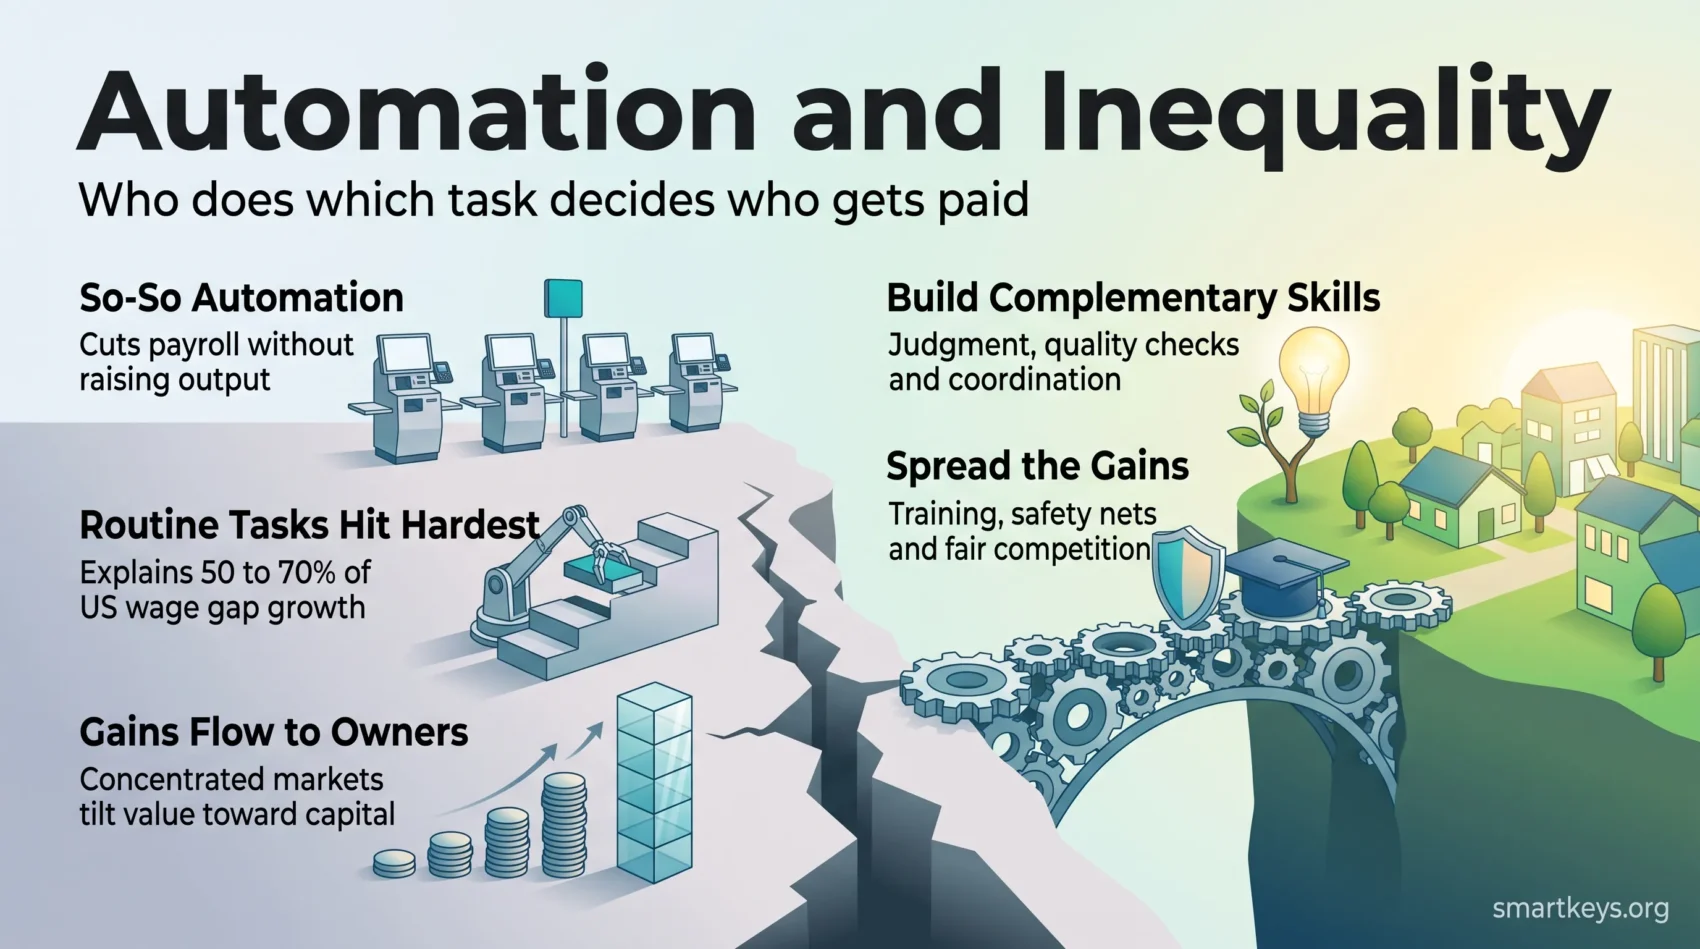
- Research links 50% to 70% of the change in the US wage structure since 1980 to the automation of routine tasks.
- Men without a high school degree lost roughly 8.8% in real wages after 1980; women in the same group lost about 2.3%.
- Some technology raises what a company can produce. Some only shifts work and cuts payroll. That difference decides who benefits.
- Market concentration and company incentives shape where productivity gains land.
- You can improve your position with skills that pair well with AI tools, and by measuring the value you add.
Why automation and inequality matter for your pay
When a company hands part of your job to a machine or a piece of software, two things can happen. The company can produce more with the same people, which usually means more work to go around. Or it can produce the same amount with fewer people, which means payroll savings that land in profits.
Which of the two happens decides whether your pay follows productivity. If output does not grow, but headcount falls, the value created by the change flows to owners rather than to workers.
A concrete example: a supermarket that installs six self-checkout lanes sells roughly the same groceries as before. It just needs fewer cashiers. The chain’s costs drop. The customer scans their own shopping. Nobody in the store earns more.
Compare that with a warehouse that adds sorting robots, wins more orders because it can now promise next-day delivery, and hires more people for packing and returns. Same technology category, very different outcome for wages.
- Track how your industry adopts new tools, and whether output or headcount changes first.
- Build skills that complement software rather than compete with it.
- Watch the gap between company output and your pay so you can negotiate or move early.
For a broader view of how technology reshapes jobs and policy, see our report on automation and jobs.
The terms in plain language
Four words do most of the work in this debate. Getting them straight makes the evidence much easier to read.
Task automation versus productivity-enhancing technology
Task automation means a machine or program takes over a specific duty: scanning items, entering invoice data, sorting support tickets. It can cut labour costs without the business producing much more.
Productivity-enhancing technology raises total output. The same team, or a bigger one, delivers more than before.
Economist Daron Acemoglu calls the first category “so-so automation”, because it moves work around instead of expanding what the economy can produce. The distinction matters because only the second type reliably creates the extra demand that pulls wages up.
Labour share and capital share
Labour share is the slice of what a business produces that goes to workers as pay. Capital share is the slice that goes to owners and investors as profit and returns.
When capital share rises, your wage can stall even while the company reports record output. Watching that split tells you more about your prospects than any single productivity headline.
- Jobs are bundles of tasks, and tasks differ in exposure. Your risk depends on the mix.
- Ask who captures the gains in your sector, not just whether the technology works.
- Knowing these terms helps you choose which skills to strengthen. Our guide to future job skills goes deeper.
From looms to LLMs: a short history
From water frames to large language models, technology has repeatedly reordered which jobs exist and what they pay. Each wave lifted total output. Each also reshuffled who benefited.
The Industrial Revolution and the Luddites
The first powered machines in British textiles triggered the Luddite protests. Skilled weavers saw their trade broken into simpler tasks that lower-paid workers could do. The uprisings were suppressed by 1816, but the underlying complaint was not about machines in the abstract. It was about who kept the gains.
Agriculture to manufacturing to services
Over the following two centuries, workers moved out of farming into factories, then out of factories into services. Every transition changed which skills earned a premium. It also stranded people who had trained for the previous world, often for a decade or more. That lag is the part that policy usually handles badly, and the reason mid-career retraining matters so much now.
When productivity outpaced pay
Living standards rose steeply after the steam engine and electricity. Since the 1980s, though, US output per hour has grown faster than typical pay. The economy kept getting more productive. The average paycheque stopped keeping up.
Technology drives growth. Policy and market structure decide who shares the gains.
What the research shows about wage gaps since 1980
The clearest evidence comes from Daron Acemoglu and Pascual Restrepo, whose study “Tasks, Automation, and the Rise in US Wage Inequality” was published in Econometrica in 2022. They matched task changes inside industries to pay outcomes for demographic groups across the US labour force.

Their headline finding: between 50% and 70% of the changes in the US wage structure from 1980 to 2016 are accounted for by the relative wage declines of worker groups specialised in routine tasks in industries that automated quickly.
The effect is concentrated by education. Men without a high school degree saw real wages fall by about 8.8% over that period. Women in the same group saw a fall of roughly 2.3%. These are inflation-adjusted numbers, not slower growth.
- The authors combined industry data from the Bureau of Economic Analysis, robot adoption measures, and Census and ACS samples covering around 500 demographic groups.
- Other forces mattered too, including weaker unions and rising market concentration. They do not explain the pattern on their own.
- Use the study as a comparison tool: check whether your local industry mix looks like the ones that automated fastest.
“So-so automation” versus technology that raises output
Not every new system lifts what an economy produces. Some simply move work from a paid employee to a machine, or to the customer. That split shapes who gains and who loses hours.
Self-checkout as a labour-shifting device
Self-checkout is the textbook case. A store cuts payroll by asking shoppers to scan their own items. Total output barely moves, because the same groceries are sold either way.
The result: lower wage costs show up as margin, not as higher pay or better service.
It’s a labor-shifting device, rather than a productivity-increasing device.
Who benefits when output barely moves
When a company produces no more than before, the savings go to owners and investors. Lower-paid service workers absorb the loss in hours. Retail and hospitality feel this first, because their tasks are scripted and easy to hand over.
- Ask whether the tool arriving in your job cuts costs or actually raises output.
- Shift your time toward work that neither a machine nor a customer can easily do.
- Notice whether your employer’s incentives favour cost-cutting over growth, because the two lead to very different job outcomes.
Polarisation: where the middle-wage jobs went
Job growth has clustered at the top and the bottom of the pay scale, leaving the middle thinner.
Research by MIT economist David Autor documented a rise in high-paid professional roles and in low-paid service work between 1989 and 2007, while middle-wage clerical and production jobs shrank. The common feature of the shrinking group was routine tasks: predictable, rule-based steps that software handles well.
Why this matters to you: the risk is not tied to how hard your job is. It is tied to how predictable your tasks are. A well-paid job full of repeatable steps can be more exposed than a lower-paid job that needs improvisation and physical presence.
- Local sector mix drives exposure. Some regions lost far more middle-wage jobs than others.
- Polarisation weakened bargaining power for many workers, which slowed wage growth further.
- The practical move is to build toward tasks that require judgment, negotiation or hands-on work. See our guide to adapting to job automation.
Industries and tasks most exposed
Looking at which sectors buy machines first tells you where jobs will shift.
Robots in manufacturing and electronics
Manufacturing and electronics still lead. The International Federation of Robotics counted 542,000 industrial robots installed worldwide in 2024, bringing the global operational stock to about 4.66 million units. US installations came to 34,200 in the same year.
Robots change shop-floor work more than they erase it. Assembly duties become monitoring, maintenance, quality checks and exception handling. Those roles pay reasonably, but there are fewer of them, and they need different training. Our piece on robotics in the workplace covers what that transition looks like day to day.
Services under pressure
Retail, call centres and back-office support face software rather than robots. Self-checkout, ticket routing and chatbots all reduce the number of people needed per transaction.
The buy-now-pay-later company Klarna is the most cited example, and also the most instructive one. In 2024 it said its AI assistant was doing the work of 700 customer service agents. By May 2025 the company had reversed course and started hiring human agents again, after chief executive Sebastian Siemiatkowski said the cost savings had come at the expense of customer experience. Automation in services is real, but the first version often overshoots. Our review of AI chatbots in customer service looks at where the line currently sits.
- Most exposed tasks: rule-based, repetitive and data-heavy work.
- Least exposed: work needing physical presence, judgment under uncertainty, or a relationship.
- Practical check: list your duties for one week and mark each as scripted or judgment-based.
Automation and inequality: who does which task decides who gets paid
The wage effect runs through tasks, not job titles. When duties move from people to machines and total production does not rise to match, income shifts toward owners and toward the smaller group of high-paid workers who run the new systems.
That is the mechanism behind the numbers above. It also explains why the effect is uneven: groups doing the most routine work lost the most, while groups doing analytical or interpersonal work were largely unaffected.
Bargaining power multiplies the effect. In a local labour market with one dominant employer, workers have fewer alternatives, so productivity gains are easier to keep. Where unions or tight labour markets give workers options, more of the gain shows up in pay. Related reading: tech worker unionisation.
What AI is changing right now
The current wave differs from the robot wave in one important way. Robots displaced manual, mid-wage tasks. Large language models are easiest to plug into computer-based, higher-paid work.
Where exposure is highest
The OpenAI and University of Pennsylvania study “GPTs are GPTs”, published in Science in 2024, mapped which occupations could have a large share of their tasks touched by language models. Exposure rises with pay across most of the distribution: higher-income, college-educated, screen-based roles are more exposed than manual ones. These jobs already run on text, code and cloud tools, so integration is quick.
Task-level gains, and who captures them
In a field study of 5,179 customer support agents, published in the Quarterly Journal of Economics in 2025, Erik Brynjolfsson, Danielle Li and Lindsey Raymond found that access to an AI assistant raised issues resolved per hour by 14% on average. The effect was concentrated among newer staff: about 34% for novice and lower-skilled agents, and close to nothing for the most experienced ones.
That is a genuine productivity gain, not a labour-shifting trick. Whether it reaches paycheques depends on the employer. If output targets rise by the same 14%, the gain has been absorbed.
What you can do: measure the time you save, record the quality of the output, and bring both to your review. Guidance on performance-based pay is useful preparation.
The 2026 employment signal
Stanford’s Digital Economy Lab tracks payroll data from ADP for the paper “Canaries in the Coal Mine?”. Its August 2026 update reports that employment for workers aged 22 to 25 in the most AI-exposed occupations sits about 19% below where it would be had it tracked similarly aged workers in less-exposed occupations. The gap widened from 15% in July 2025.
Two details matter. Experienced workers show no comparable gap. And the adjustment shows up mainly in reduced hiring rather than layoffs or pay cuts, which means the cost falls on people trying to enter these fields. Our article on Gen Z and the future of work covers what that means for early careers.
Why gains flow to owners
Two forces push returns toward capital: systems that finish whole tasks, and markets where a few firms dominate.
From assistance to full task takeover
Early tools assisted people. Newer systems can complete an end-to-end process without steady human input, from invoice matching to first-line support.
The consequence: if total production does not grow enough to justify hiring, a larger share of the value goes to whoever owns the system. Remaining roles drift toward oversight and exception handling, and those roles do not absorb everyone displaced. See our guide to redeploying staff after automation for what a managed transition looks like.
Market concentration and winner-take-most dynamics
In software, scale gets cheaper as it grows. Serving the ten-millionth customer costs a fraction of serving the first. Combine that with data advantages and switching costs, and a small early lead compounds into durable market power.
Why this reaches your pay: in a concentrated market, fewer employers compete for your skills, and price and wage norms are set by a handful of firms. Competition enforcement and labour standards are the two levers that rebalance this without slowing innovation. The current policy picture is covered in our guide to future of work legislation.
Geography and demographics: who is most at risk in the US
Where you live shapes your exposure as much as what you do. Two people with the same job title face different risks in a manufacturing town and a services hub.
Education, age and local labour markets
The Acemoglu and Restrepo data show the largest wage and employment losses among groups with less formal education. Age cuts both ways: younger workers in exposed occupations now face a hiring squeeze, while older workers have fewer years over which retraining pays back.
Counties heavy in manufacturing saw sharper job losses in the robot wave. Service-dominated regions face a slower, broader squeeze from software instead. Our analysis of demographic shifts at work adds regional detail.
Signals worth watching locally
- Which employers are running automation pilots, and whether pilots move to full deployment.
- Vacancy trends in your occupation, especially at entry level.
- Whether local training providers and employers run joint programmes. See talent pipeline partnerships.
Three scenarios for the next decade
Nobody can date the next shift. But the plausible paths are few, and each implies different moves.
Steady assistance
Tools keep helping people work faster, demand keeps pace, and hiring continues. If employers share the gains, pay and job quality improve together. This is the path the customer support study points to, provided the productivity gain is not simply converted into higher quotas.
A tipping point in services
Some service tasks may cross a reliability threshold, at which point companies cut headcount quickly. Klarna’s reversal suggests the threshold is further away than the 2024 announcements implied, but it will arrive for some workflows.
Broad general-purpose systems
If capable systems spread across many task types at once, the mix of work changes faster than training systems can respond. Labour demand falls in some roles while high-end and hands-on work grows.
- Watch the signals: cost per task, adoption rates, and independent benchmarks rather than vendor claims.
- Prepare moves: cross-skill, redesign your role, or shift to an adjacent sector.
- Align your finances: build a cash buffer and plan time for retraining before you need it.
Policy playbook: spreading gains and cushioning shocks
Policy decides whether productivity gains reach paycheques, public goods or margins. None of the options below stop innovation. They change who benefits from it.
Training that matches real demand
Short courses, on-the-job mentoring and sector partnerships work better than broad retraining schemes, because they are built around jobs that actually exist locally. Our look at upskilling trends covers what has held up in practice.
Safety nets that match adoption speed
Unemployment insurance, wage insurance and relocation support only help if they last as long as the transition does. Support that ends after six months does not bridge a career change that takes two years.
Competition rules, bargaining power and tax design
Antitrust enforcement keeps labour markets contestable. Collective bargaining gives workers a share of the gains. Tax design decides what funds training and local infrastructure. The proposal to tax automation directly is contested on both economics and practicality, and we weigh the arguments in the robot tax debate. Employers also face new duties on workplace AI under the EU AI Act, particularly around AI hiring tools and AI employee monitoring.
What you can do now
Small, measurable moves beat a grand plan. Start with the tasks you already own.
Build complementary skills
The valuable skills are the ones a model cannot supply: domain judgment, quality checking, coordinating people, and knowing which question to ask in the first place. Pair them with practical fluency in the tools your team uses. The support-agent study suggests the biggest gains go to people who are still learning, which is an argument for adopting tools early rather than waiting.
Track signals and prove your value
- Watch pilots, vendor deals and hiring changes in your sector. Our overview of AI in the workplace tracks the broader picture.
- Sort your weekly tasks into scripted and judgment-based, then shift your time toward the second group.
- Record outcomes, not effort: hours saved, errors avoided, revenue influenced. That is what turns a productivity gain into a pay conversation.
- Build optionality by testing adjacent roles before you need one, while you still have the time to choose.
Conclusion
Automation is not a single force with a single outcome. It is a set of choices about which tasks move, how fast, and who keeps the savings.
The evidence is clear on the past. Task displacement explains most of the widening US wage structure since 1980, and the losses fell hardest on workers with the least formal education. The evidence on AI is younger and more mixed: real productivity gains in some settings, a visible hiring squeeze for young workers in exposed occupations, and at least one high-profile reversal.
What you control is your task mix, your evidence of value, and how early you move. What policy controls is whether the gains stay concentrated. Both matter, and neither is settled.
Found this useful?
Make SmartKeys a preferred source on Google, and our articles will surface more often in your Top Stories, AI Overviews, and AI Mode.
Add as Preferred Source