You need every team to read reports, ask better questions, and make smarter choices. Today in the world of analytics, leaving insight to a few specialists slows you down and risks costly errors.
Our approach meets your people where they are. We focus on real problems, clear outcomes, and hands-on learning that fits day-to-day work.
From leaders to frontline staff, small habits add up to big gains. You get a clear roadmap, simple frameworks, and coaching that build confidence and lasting culture.
Align the course agenda to your function—marketing, finance, product—so skills stick and support the metrics that matter to your business.
Key Takeaways
- Make understanding and using information a shared capability across teams.
- Practical training turns routine choices into measurable wins.
- Tailor learning to roles so adoption is fast and visible.
- Leaders and managers model short habits that scale performance.
- A clear roadmap and friendly coaching create lasting cultural change.
- Focus on outcomes first, then fit training to your tools and work.
Why Data Literacy Matters Now for Your Business
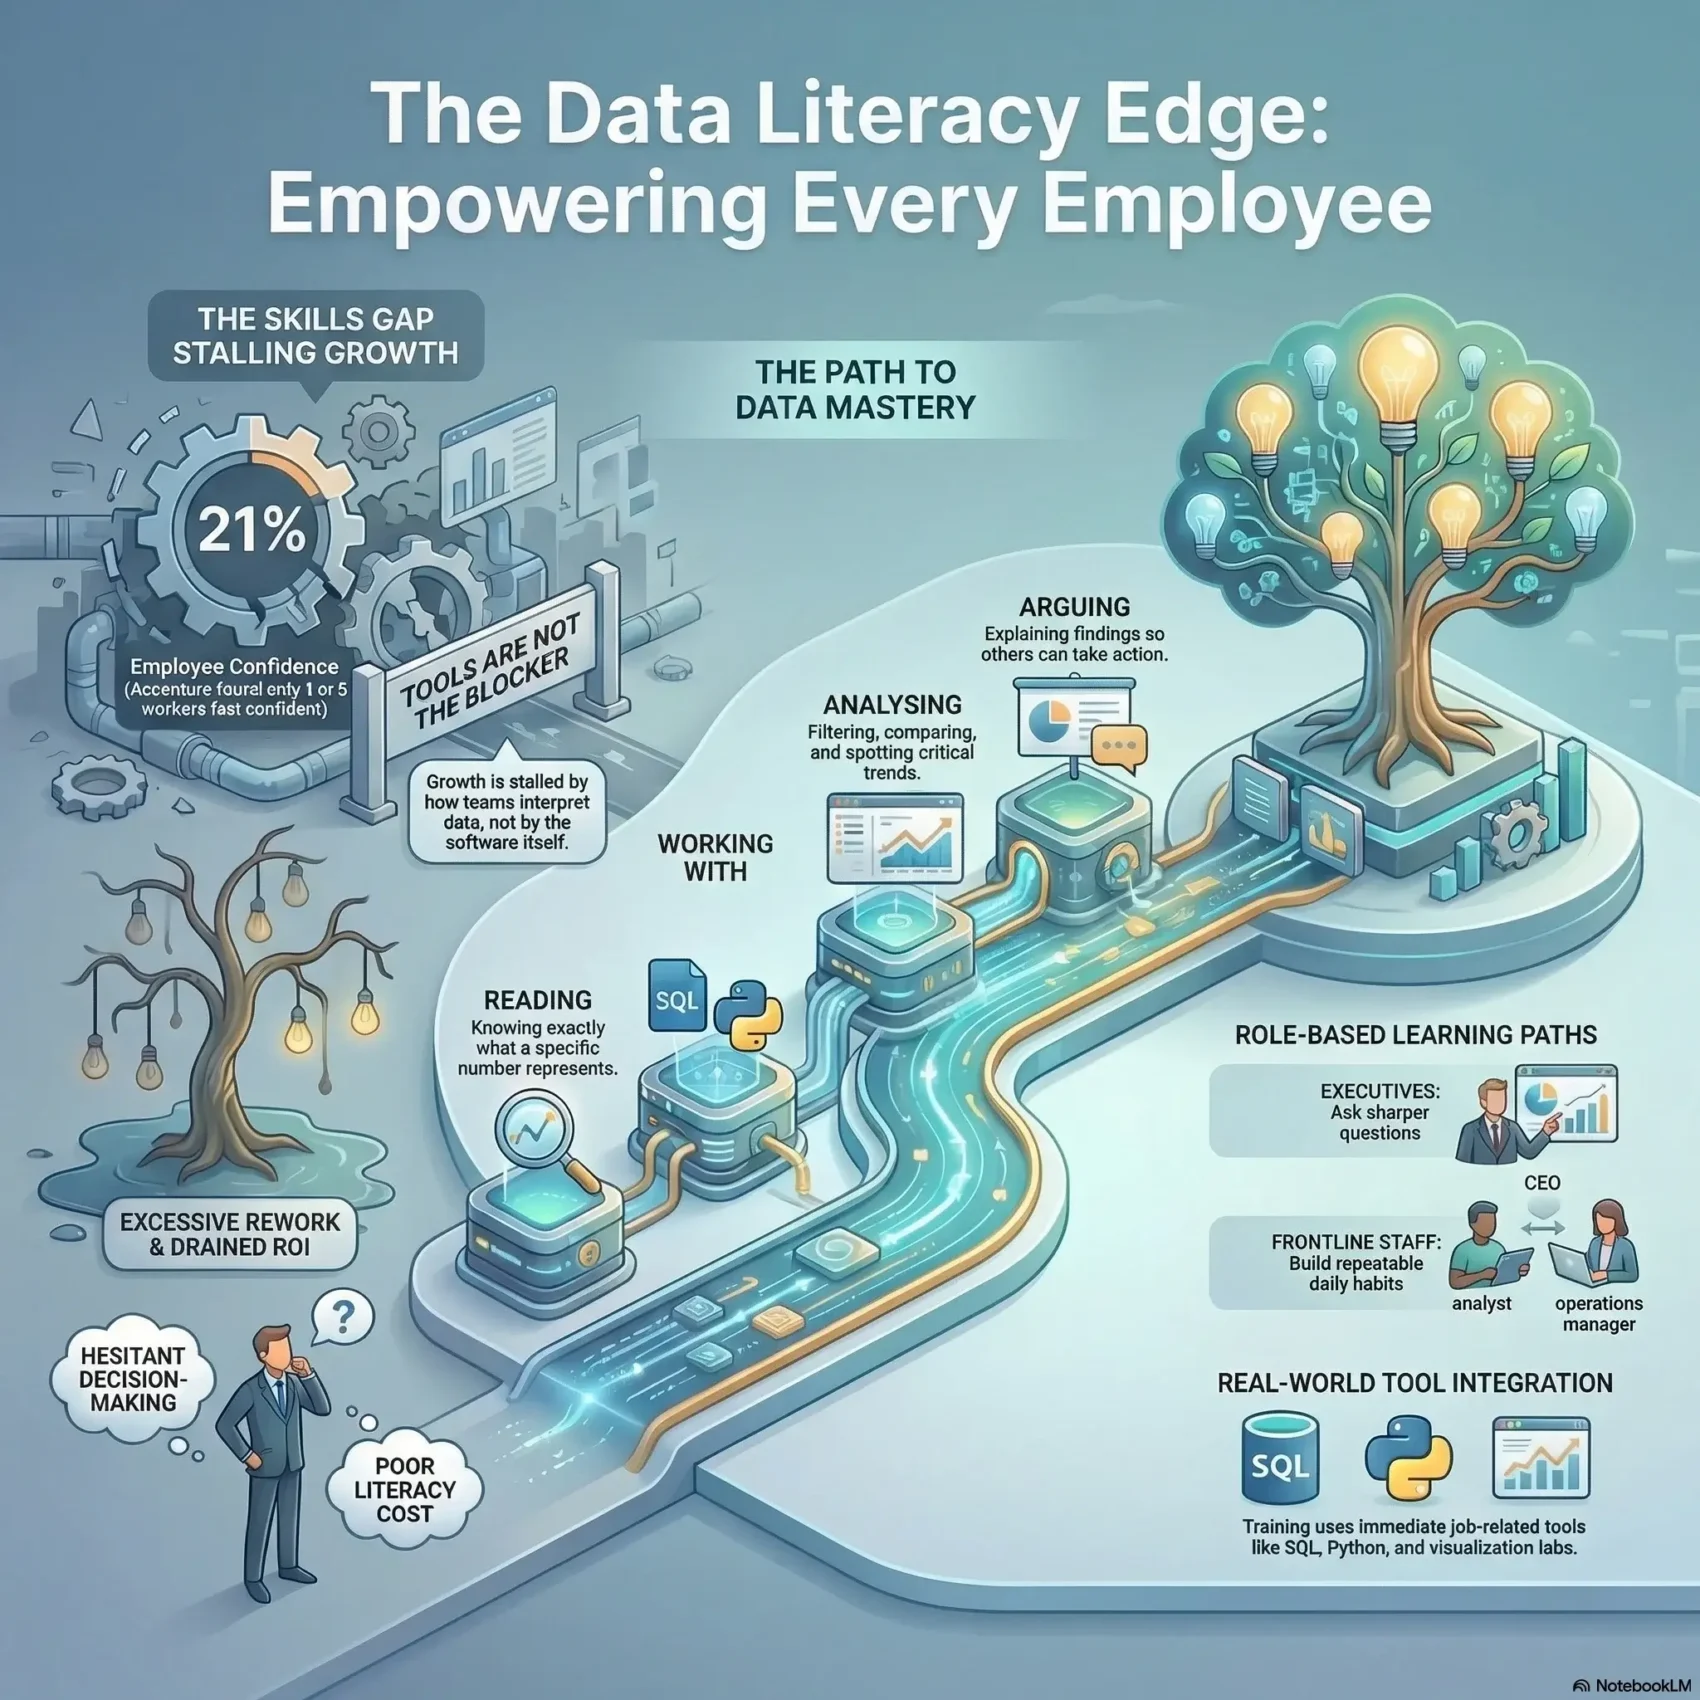
Today, the biggest blocker to faster growth is not tools — it’s how your teams use what those tools show. Poor skills around numbers and charts stall decisions, create rework, and drain ROI.
The skills gap that slows growth: Only 21% confident
Accenture found just 21% of workers feel confident in their ability to use information. That means most people hesitate to act on insight, and your analytics momentum stalls.
What this capability really means by role
Reading means knowing what a number represents. Working with means creating, cleaning, or managing files. Analysing means filtering, comparing, and spotting trends. Arguing means explaining findings so others can act.
From frontline decisions to leadership
When servers, drivers, and agents get timely insight, customer satisfaction and productivity rise. Leaders then back the change by setting expectations, giving time for training, and recognizing curiosity.
- Role-based focus: not one-size-fits-all; match training to actual work.
- Graphical skills: teach people to read charts and spot misleading visuals.
- Shared vocabulary: align on definitions so analysis drives outcomes.
“Only 21% of more than 9,000 surveyed employees feel confident in their skills.”
Our data literacy program: Tailored training that meets your teams where they are
We begin by mapping what your teams already know and where quick wins live.
Baseline assessments give a clear snapshot of current proficiency by role. These short assessments let you right-size learning paths and cut wasted time.
Right-sized paths for every role
Executives learn to interpret insight and ask sharper questions. Managers practice coaching to results. Frontline staff build simple, repeatable habits that improve daily workflows.
Flexible delivery and practical tools
Your teams pick a blend: hands-on sessions, self-paced courses, and guided on-the-job application. We simplify tools so people spend less time fighting interfaces and more time thinking about meaning and impact.
Beyond tools: language, leaders, and culture
We set common definitions and metrics to remove confusion. Leaders sponsor kickoffs and model expectations. Small rewards and safe forums encourage curiosity and faster adoption.
- Measurable outcomes: adoption, cycle time, and KPIs tracked with lightweight assessments.
- Real work focus: each module ties to a workflow so results are immediate.
- Scalable strategies: repeatable paths aligned to your analytics roadmap.
What your teams learn and how it drives results
This short, hands-on course teaches people to frame questions and extract useful insight fast. You get a tight syllabus that applies to everyday work and leads to faster, more trusted decisions.
Prerequisites: basic Python (types, conditionals, loops, functions) and core math — probability, distributions, and basic linear algebra and statistics. Optional refreshers are available.
From understanding to analysis and storytelling
Your team practices exploratory analysis step by step: profile columns, check quality, spot outliers, and summarize patterns. Hands-on sessions use Pandas and NumPy to clean and shape tabular sets.
Visualization labs teach Matplotlib and Seaborn so people pick the right charts, annotate clearly, and avoid misleading visuals. Participants also learn clean SQL for reliable queries and sanity checks.
- Ask first: frame questions and align definitions before analysis.
- Hands-on skills: cleaning, transforming, and visualizing real files.
- Communicate: structure concise narratives that link findings to owners and action.
- On-the-job checks: quick assessments, templates, and checklists to reuse in your analytics workflows.
Conclusion
You can move from hesitation to clear action in months when training ties to real work. Measurable progress is possible within a year if you pair hands-on courses with clear success metrics and live projects.
Long-term gains depend on access to quality data and leaders who model analytic habits. Align learning with your maturity efforts so understanding spreads and analysis becomes reliable across roles.
Teams leave with practical skills, shared understanding, and the confidence to turn information into outcomes that matter for your business.
Ready to start? Enroll a cohort in our digital literacy for business course, capture quick wins, and scale a culture that speeds decisions and raises performance.