Last Updated on December 13, 2025
You need clear ways to measure how your team converts time and effort into real results. The U.S. Bureau of Labor Statistics reported a 0.8% drop in worker productivity in Q1 2025, the first decline since 2022. That shift makes it more important than ever to pick the right measures.
Good metrics quantify value created versus inputs. They are often shown as total output divided by total input. But poorly chosen metrics can demotivate staff and create busywork.
This section gives you a practical roadmap. You will learn which indicators to trust, how to measure them, and how to turn numbers into action. We also cover why executives and individual contributors may prefer different views—visibility and activity versus goals and KPIs—and how to bridge that gap.
Key Takeaways
- Use a balanced set of measures that reflect real output, not vanity numbers.
- Align daily work to clear goals so your team sees how tasks support the business.
- Choose metrics that help sales, support, and development teams meet revenue targets.
- Turn data into simple dashboards that reveal bottlenecks and next steps.
- Sequence measurement so the team understands the why behind each measure.
Why measuring productivity matters now: aligning your team with real outcomes
Measuring how your team turns hours into outcomes helps you focus on what really moves the business. When you shift from counting presence to tracking progress, your employee sees how daily work maps to goals.
Slack’s 2023 State of Work found executives often index visibility and activity, while most employees prefer evaluation by goals and KPIs. Staff report higher output with flexible schedules, fewer meetings, and access to time-saving tools and automation.
You measure results to connect team productivity to outcomes, so every number has a clear purpose. Pair quantitative metrics with short qualitative signals to make evaluations fair and human.
- Shift focus from presence to progress to cut performative meetings and save hours.
- Surface areas of improvement like slow approvals, tool fragmentation, and unclear ownership.
- Use a handful of clear KPIs so teams can act fast and managers support sales and other high-impact areas.
“Employees are most productive when they have flexible work, fewer meetings, and better automation.”
When you frame measurement as a path to growth and recognition, your team will help refine the ways you evaluate work and suggest smarter tools.
Foundations: what productivity, efficiency, and effectiveness mean for your organization
Start by clarifying what each measurement actually tells you about the work your team delivers. A quick shared vocabulary stops confusion and helps you pick measures that drive real change.
Defining the terms
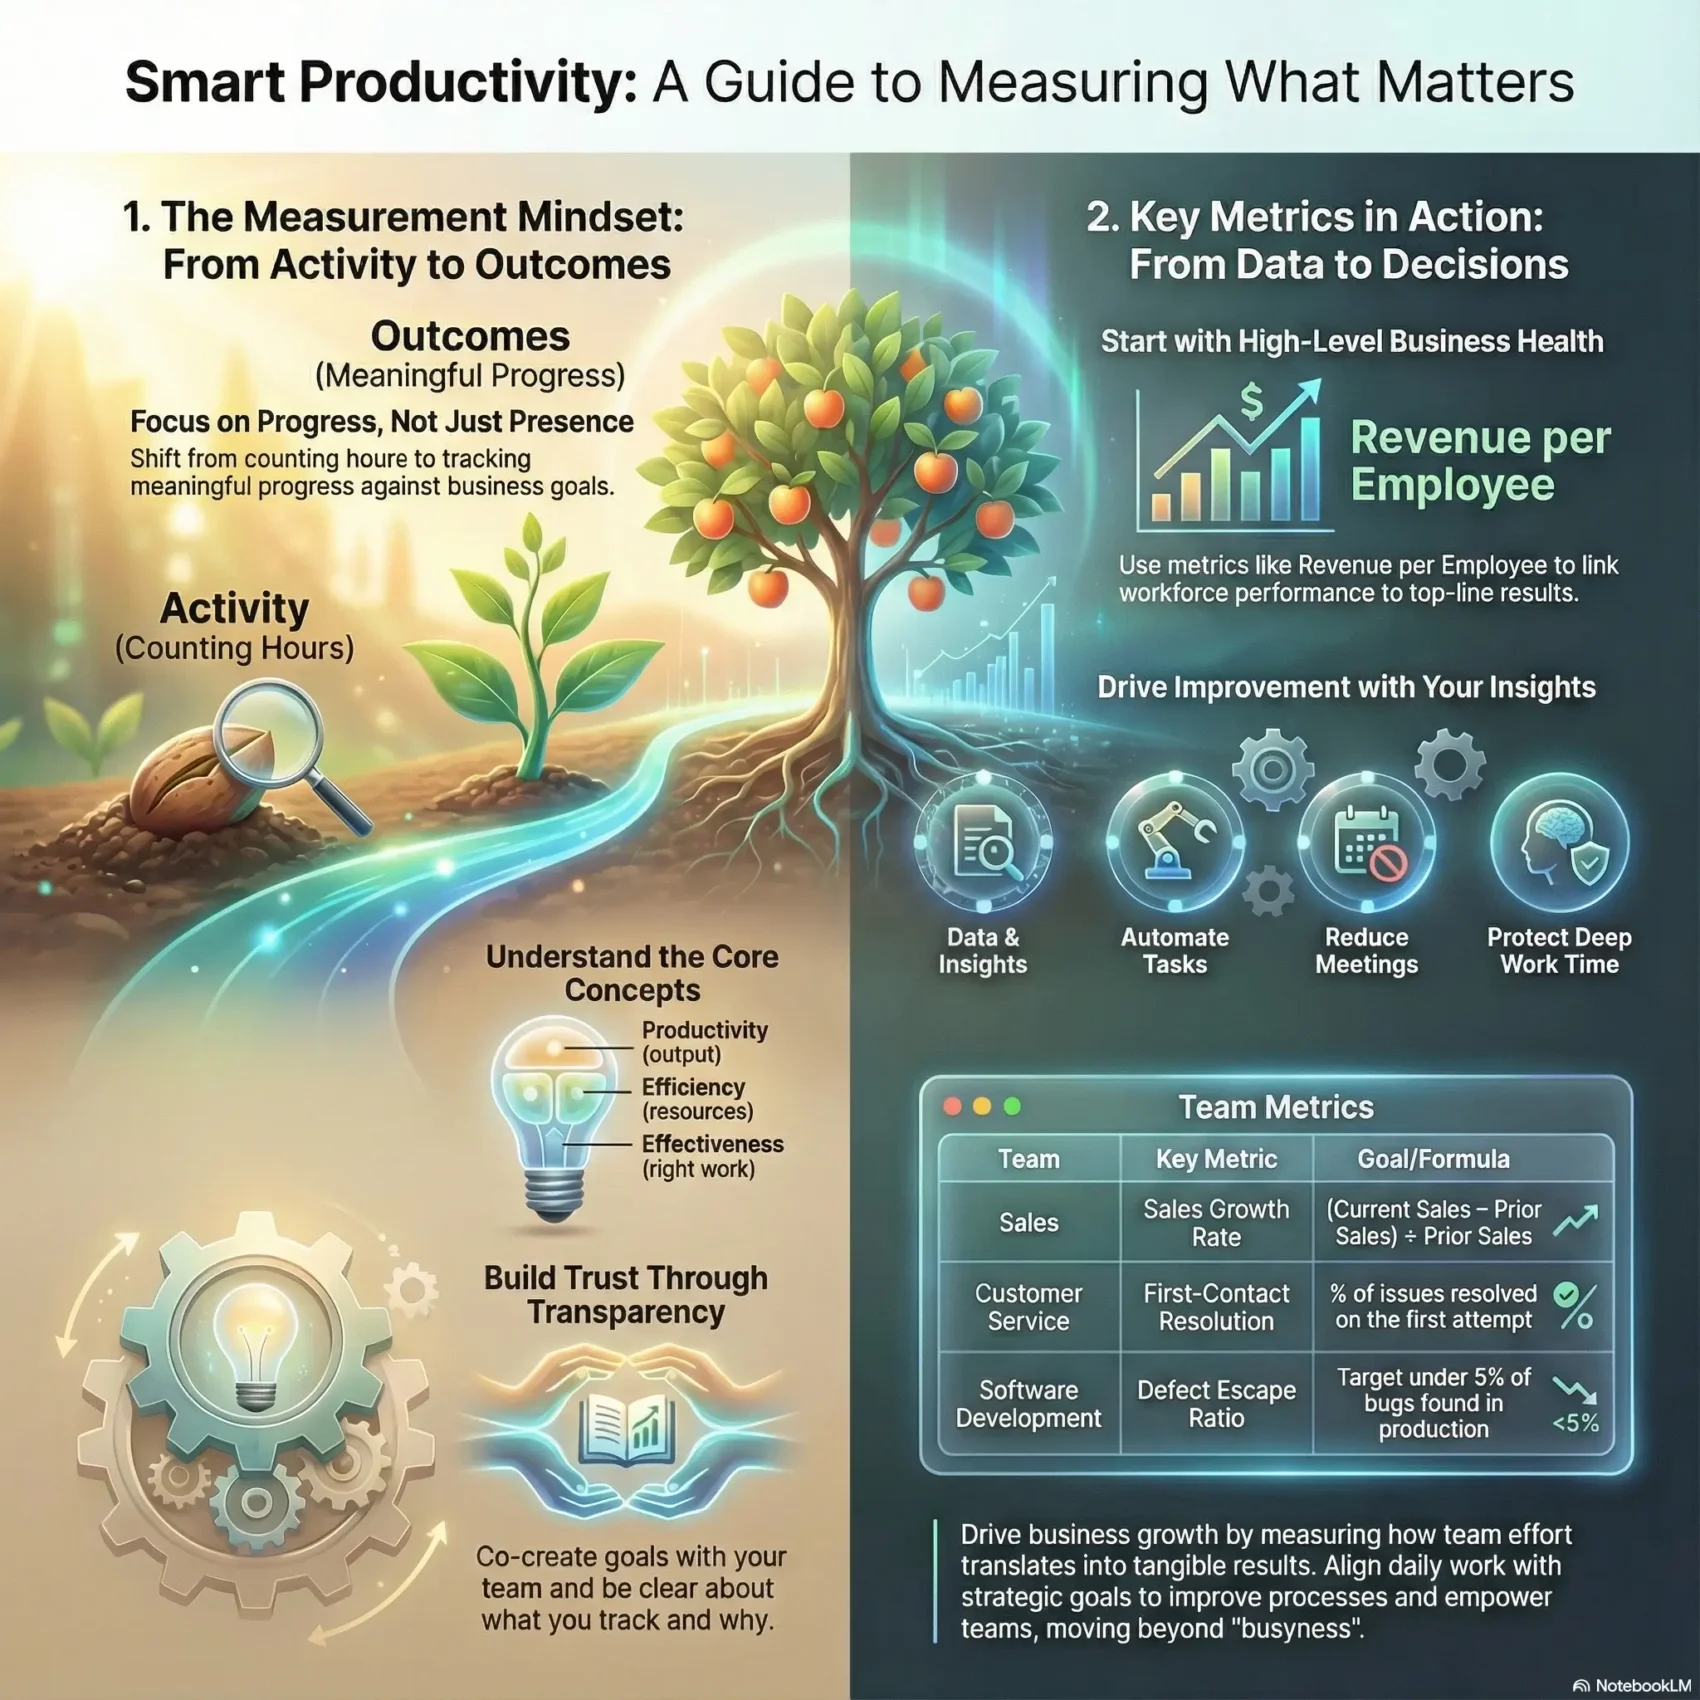
Productivity describes how much you produce. Efficiency shows how well you use resources and cut waste. Effectiveness checks whether you are doing the right work for the organization.
Inputs, outputs, and the basic formula
Use the simple formula: total output divided by total input. Tie every chosen metric to that ratio so hours and effort clearly map to results.
Hard metrics and soft signals
Combine hard KPIs—rates, percentages, error counts—with soft signals like morale and focus. This balance protects quality while improving rate and speed.
Activity versus outcomes
Avoid vanity numbers that reward volume over value. Choose a metric only when a clear process exists to influence it. That way your employee can act, and sales or support teams see meaningful improvement.
- Define what “good” looks like for each role.
- Watch trade-offs between rate and quality.
- Prioritize measures you can change through process updates.
How to choose the right productivity metrics for your goals
Begin by naming the outcome you want—faster revenue growth, fewer defects, or higher retention. When you pin down the goal, you can map which tracking points truly show progress.
Start with business outcomes, then map measures to roles and processes. For each outcome, pick one clear metric per role so every employee knows how daily work changes the number.
Use layered data: output, quality, and workload signals. Slack’s 2023 State of Work found leaders favor visibility while contributors prefer evaluation by goals and kpis. Combine task counts with responsiveness and tech adoption to get a fuller view.
Watch common pitfalls: don’t over-index on visibility or simple rates that can be gamed. Stress-test a metric—if teams can boost the rate without improving customer value, drop it.
- Define targets and acceptable ranges for each metric.
- Map each indicator to a specific process and role.
- Align incentives so improvements stick and feed revenue or satisfaction.
“Use layered data so you make decisions with confidence, not just appearance.”
Organization-wide productivity metrics you can trust
Pick measures that show how your workforce drives the company’s top-line results. Start with three organization-level indicators you can compare over time and against peers.
Revenue per employee: linking workforce size to revenue
Revenue per employee is total revenue divided by headcount. This number shows how effectively your organization turns staff into sales.
Calculate it quarterly and trend it against sales growth. Use it to spot where hires raise revenue or create drag.
Employee utilization: billable time, focus hours, and capacity
Track utilization as billable hours over eligible hours. Include protected focus hours so capacity models value deep work, not meetings.
Set healthy percentage thresholds to avoid overbooking or chronic idleness and review by role and region.
Total cost of workforce: connecting spend to performance
Total cost of workforce (TCOW) bundles salaries, recruiting, onboarding, training, HR ops, and contingent labor.
Trend TCOW against revenue and total expenses to find efficiency gains. Combine these three numbers to generate actionable insights about where to invest—like enablement for your sales team or automation to cut admin time.
- Calculate revenue per employee and compare over time.
- Use utilization and focus hours to protect capacity.
- Track TCOW broadly and trend it to revenue to guide investments.
“Segment by role and region so comparisons stay fair and improvement targets are realistic.”
productivity metrics by function: measure what matters for each team
Different teams need different checkpoints to show real progress. Pick measures that match the work and the customer impact. Below are simple formulas and the signals you should track so coaching and process fixes lead to better outcomes.
Customer service
Track first-contact resolution percentage: 100 × (issues resolved on first contact ÷ total issues).
Also measure average resolution time and first-response time. These three numbers reveal where handoffs or approvals create bottlenecks.
Sales
Monitor sales growth rate: (current period sales − prior period sales) ÷ prior period sales × 100.
Pair that with average revenue per sales rep (revenue ÷ number of reps). Compare cohorts by territory and seniority to set realistic targets.
Software development
Use defect escape ratio: (bugs found in production ÷ total bugs) × 100. Many teams target 5% or less.
Balance throughput with code review and test coverage so quality keeps pace with release cadence.
Remote work
Watch virtual meeting load (hours per week), response time to messages, and signs of digital presenteeism.
Measure home-office satisfaction and logged distractions to find small fixes that free up deep work hours.
“Keep each number tied to a clear process so coaching stays focused on the right tasks.”
Turning data into decisions: tools, dashboards, and segmentation that reveal insights
Surface hidden handoffs and approval delays by analyzing your team’s message flows. Communication platforms like Slack reveal where requests pile up or approvals lag without invasive monitoring. Use those signals to guide focused fixes, not to watch people.
Using internal communication analytics to spot bottlenecks
Monitor responsiveness, channel usage, and message volume to find where work stalls. Track thread length, time-to-response, and handoff frequency to turn invisible bottlenecks into actionable items.
Building people analytics dashboards for KPIs, trends, and cohorts
Keep dashboards simple. Combine a few kpis, trend lines, and cohort views so managers can compare like with like.
- Show leading and lagging indicators such as backlog age and cycle time.
- Add short qualitative notes to explain sudden shifts.
- Design alerts for threshold breaches so decisions happen in real time.
Segmenting by role, complexity, and priority to benchmark fairly
Segment data by role, work complexity, and priority so routine tasks aren’t measured against high-variance work. That keeps comparisons fair and coaching useful.
Pick the few tools your teams actually use and integrate them so data flows cleanly and the number of dashboards stays manageable. Periodically audit what you track and retire any number that no longer drives value.
For a practical guide on setting the right measures and tools, see measuring productivity.
Governance and ethics: measuring performance without micromanaging
Set rules that protect focus and trust before you turn data into decisions. Good governance gives your teams clear norms so measurement helps, not harms.
Start by co-creating goals with each employee. Agree on outcomes, acceptable work rhythms, and how the organization will use each number. That approach replaces spying with partnership.
- Establish clear goals and norms so your teams know what great performance looks like without invasive surveillance.
- Co-create expectations in regular check-ins to balance workload and keep quality high as work changes.
- Use transparent dashboards and simple engagement rules to protect focus time and celebrate outcomes.
- Reward effectiveness and quality, not just volume, to prevent burnout among high performers.
Define acceptable data practices and explain why you track each number. Invest in training so people can read dashboards and use tools responsibly. That turns measurement into a learning habit, not punishment.
“Employees report higher productivity when employers embrace flexibility, provide time-saving tools, and reduce unnecessary meetings.”
Finally, create a short ethics checklist for new measures and gather feedback often. Make governance part of your culture so accountability remains clear, fair, and human — even for your sales team and other areas with different contexts.
For a practical guide on setting the right measures and tools, see measuring productivity.
Proven ways to improve productivity without sacrificing quality
Small changes to how you run work can unlock hours and raise quality across the team. Start by targeting clear friction points and low-value steps before buying new tools.
Automate and apply AI where it saves time and boosts decisions
Automate repeat approvals, ticket routing, and code review so your people spend more hours on complex, high-impact work. Use AI to surface trends and speed routine content tasks.
Reduce meeting load and improve meeting effectiveness
Audit recurring meetings and cut the 43% that add no decision or owner. Set rules: async updates in shared docs and meetings for clear decisions only.
Protect deep work and minimize context switching
Schedule focus blocks and defined handoff windows. Fewer interruptions mean better development and higher quality output.
Invest in training, coaching, and better processes
Tie training and development to the number and trends from your dashboards. Run monthly experiments on one process, measure before and after, and share insights.
Support flexibility to increase engagement and output
Align office days for collaboration and remote days for deep tasks. Give managers playbooks to diagnose areas improvement—tool friction, unclear owners, or overloaded calendars—and fix them fast.
“Fewer unnecessary meetings and access to automation let employees reclaim time for higher-value work.”
From metrics to movement: a simple rollout plan for your team
Launch changes in small steps so your team can learn fast and avoid costly rollouts. Start by picking a small set of kpis and one clear metric per role. Define baselines for each number so you know where you began.
Pilot with one team and resource that pilot with the tools and support they need. Run short feedback loops of two to four weeks and iterate on process and dashboards.
Practical rollout checklist
- Establish baselines and cohort segmentation so comparisons stay fair.
- Publish a one-page plan: goals, owners, cadence, and success criteria.
- Set capacity thresholds (for example, productive time within ±30% of goal) to avoid over- or underutilization.
- Tailor dashboards for sales, customer support, and development so each group sees relevant insights.
Equip managers to host lightweight reviews that celebrate wins and flag bottlenecks before they slow the team. When a pilot meets readiness—stable kpis, clear owners, documented process—formalize the handoff to scale.
“Run small pilots, share wins and misses, and keep a living playbook so improvement becomes part of how your organization works.”
Conclusion
, End each measurement cycle with one practical change that improves how your team works. Choose a focused set of productivity metrics that tie daily work to clear goals for your business and company.
Balance hard KPIs with soft indicators. Align on kpis in 1:1s so executives and employees share priorities. Use automation, fewer meetings, and flexible schedules to boost efficiency and satisfaction.
Protect deep work, right-size meeting load, and segment fairly so comparisons stay useful. Track trends like rate or percentage changes tied to revenue and customer outcomes. Iterate, share insights openly, and treat this as a continuous improvement playbook for your sales, development, and support teams.