Last Updated on December 16, 2025
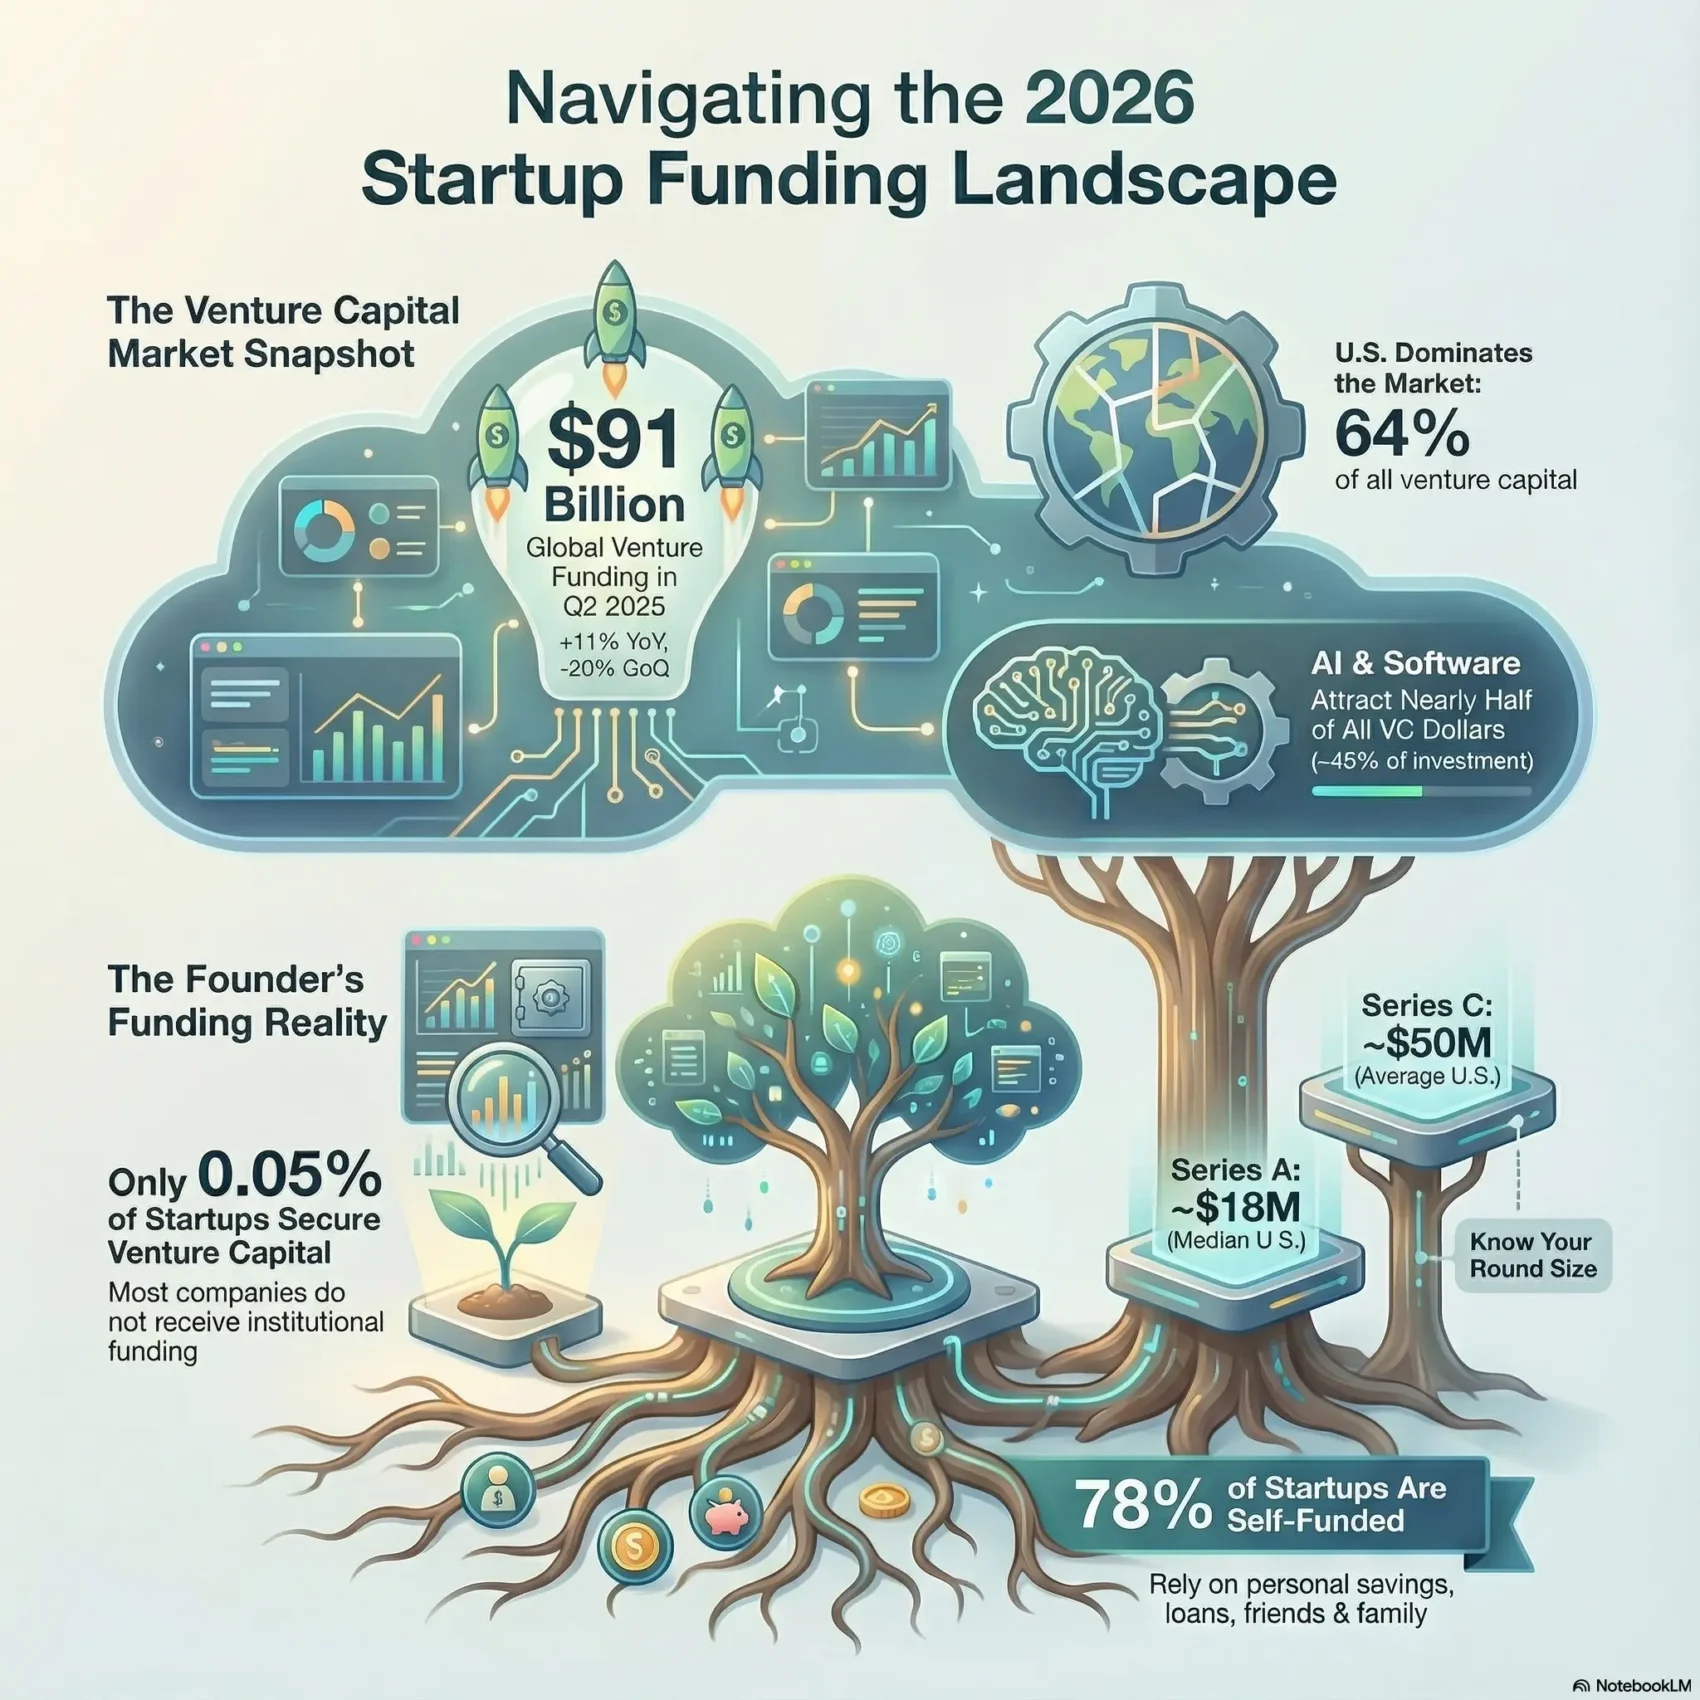
The Q2 2025 picture is telling: global venture capital hit $109 billion, with total venture activity at $91 billion in Q2 and the United States taking 64% of the pie.
Only 0.05% of startups land venture capital, while roughly 77–78% rely on personal savings, loans, or help from friends and family.
AI and software drew 45% of VC dollars, shaping valuations, hiring, and competition across tech companies and adjacent services industries.
This short guide helps you translate these signals into concrete steps for growth. You’ll learn to set realistic milestones, pick the right partners, and protect runway so you keep options open if capital windows tighten.
Key Takeaways
- Q2 2025 shows resilient year-over-year growth but a q/q dip—plan for cycles.
- The U.S. dominates venture capital; location affects who you pitch.
- VC is rare; most founders use savings, loans, or personal networks.
- AI and software command nearly half of VC dollars—expect intense competition.
- Use data to set realistic traction, hiring, and runway targets.
What you’ll learn from today’s startup funding trends
What follows gives you concrete benchmarks and timing so your next raise is strategic, not frantic. You’ll see how average time between rounds (about two to three years) should shape burn rates and execution pace.
This section gives clear, usable data you can act on. The median Series A in the U.S. sits near $18 million and the average Series C in 2024 was roughly $50 million. Only 0.05% of startups secure VC, while 77–78% self-fund or use personal savings.
- You’ll learn to set milestones tied to the two-to-three year cadence and plan hires and teams around realistic runway.
- You’ll get benchmarks for round sizes so your ask matches market expectations and your hiring plan supports growth.
- You’ll understand what investors expect at each stage and how to prepare diligence early to boost your odds of success.
The funding climate in context: where capital is flowing and why
How dollars moved in Q2 2025 reveals practical signals you can use when planning a round. Global venture totals hit $91 billion, up 11% year-over-year from $82 billion but down 20% quarter-over-quarter.
Global venture funding snapshots: Q2 2025 vs. 2024
Late-stage investing stayed at $34.7 billion, flat QoQ but still below the $46 billion peak seen in Q3 2023.
Early-stage activity sits near $24.7 billion and seed rounds total about $7 billion.
U.S. share and sector concentration
The U.S. captured 64% of venture capital in Q2 2025. Software and AI drew roughly 45% of capital, which concentrates value and valuation expectations in a few sectors.
Deal volume and the retreat from 2021 peaks
Deal count and median deal sizes have normalized compared with 2021. That means fewer mega rounds and more discipline from investors focused on unit economics.
- Use this data to time outreach: YoY growth but QoQ softness affects process windows.
- Match comps to region and sector when you build your deck.
- Plan milestones for realistic years-long cadence and varied investor appetite.
Startup funding trends: the headline signals from the past year
Recent quarters make one thing clear: money is moving, but not evenly across sectors. Global venture funding reached $91 billion in Q2 2025 — down 20% quarter-over-quarter but up 11% year-over-year. You should plan for uneven momentum, not a straight recovery.
Venture capital totals, quarter-over-quarter and year-over-year shifts
Quarterly totals show a cyclical market. QoQ dips mean timelines can stretch and deal pacing varies by region and stage.
Sector leaders: artificial intelligence, software, and cybersecurity
Artificial intelligence drew nearly $19 billion — roughly 28% of the quarter — while software plus AI captured about 45% of VC. That concentration lifts related areas like developer tools and data infrastructure.
Cybersecurity saw investment rise to about $2.7 billion (Q1 2024), reflecting higher breach costs and compliance demand. As an investor or founder, weigh faster access to capital against intense competition and higher performance bars.
- Scan signals: YoY growth but QoQ softness — plan milestones conservatively.
- Calibrate asks: Match round size and timeline to sector deal count and investor appetite.
- Show quality: Highlight retention, margins, and unit economics to stand out.
Stage dynamics: seed, early, and late-stage patterns you should watch
How rounds play out across stages tells you where to set goals and how much runway to protect. Use stage benchmarks to make practical choices on hires, cadence, and investor outreach.
Seed, Series A, and Series C benchmarks
Expect a median Series A in the U.S. near $18 million. By contrast, the average Series C in 2024 landed around $50 million. These numbers guide how big your next round should be and what metrics investors will expect.
Time between rounds and runway implications
The typical time between rounds is about two to three years. Series A and B often close faster than Series C, so align hiring and product milestones to that window.
Late-stage softness and valuation discipline
Late-stage totaled $34.7 billion in the latest quarter, flat quarter-over-quarter but down from $46 billion in Q3 2023. That creates more valuation discipline and longer diligence cycles.
- Set realistic targets: match your ask to median round sizes and the proof you can show.
- Preserve optionality: consider tranches, debt, or extensions if timing slips.
- Align valuation with traction: retention, payback, and margins matter more than narrative alone.
Founder financing reality: where startups actually get their money
Most founders begin with money they already control, not a venture check. About 77–78% of startups rely on personal savings or self-funding at launch. Only 0.05% later raise institutional venture capital.
Personal savings, friends & bank options vs. VC
Many small employer firms start with very modest capital. The median initial capital is often under $25,000. Roughly 31% begin with under $10,000; about 18% start with $250,000 or more.
Alternatives include bank loans, credit cards, friends and family, angel investors, and crowdfunding. These routes can keep your equity intact and extend runway while you prove demand.
What 0.05% raising venture means for your capital strategy
You should plan around reality: validate demand, show revenue paths, and avoid assuming a priced round will arrive on schedule.
- Structure your plan: align hires and milestones to the cash you control.
- Right-size early asks: many teams start with under $25,000 and hit milestones that unlock larger checks.
- Use alternatives: evaluate loans, revenue financing, angels, and crowdfunding before diluting equity.
- Treat F&F like investors: set terms, updates, and risk disclosure to protect relationships.
- Stay scrappy: scope tight MVPs, use no-code, and prioritize revenue activities to stretch small capital into growth.
Geography of capital: Silicon Valley, New York, and beyond
Where you base your company often changes the shape of your investor pipeline. City clusters concentrate capital, talent, and buyers in ways that speed growth for the right business models.
Unicorn hubs and why they matter
San Francisco hosts about 256 unicorns, the most of any city, while New York City counts roughly 119. That density creates deep late-stage pools and repeat investors who know how to scale big outcomes.
Regional momentum: East Coast and global reach
The East Coast—DC, NYC, Boston—is growing faster in several tech categories. That growth gives you strong alternatives to the Bay if you sell to financial services, health systems, or federal customers.
- Choose Silicon Valley for deep-tech and AI labs and dense venture networks.
- Lean on New York for fintech, enterprise SaaS, and financial buyer access.
- Open a presence where you hire and sell, not just where investors sit; use virtual pitching to keep distant partners engaged.
Practical tip: Plan a focused travel calendar and prioritize well-matched meetings. Fewer, targeted conversations beat a scattershot tour across regions.
Sectors in focus: AI, fintech, proptech, and cybersecurity
Quarterly capital patterns tell a simple story: a few sectors soak up most of the money while others face tighter scrutiny.
Artificial intelligence: share of VC and market outlook

Artificial intelligence startups secured nearly $19 billion in a recent quarter, about 28% of VC. Together with software, AI accounts for roughly 45% of investment, which raises competitive pressure on hiring and tooling.
Fintech rebound risks and opportunities
Fintech can rebound, but you must weigh regulatory shifts, fraud exposure, and acquisition costs. Focus on durable revenue niches like payments infrastructure and B2B services to show resilience.
Proptech deal size reset and investor appetite
Proptech saw average deal sizes fall from $48.9M in 2021 to $16.8M in 2023. Total VC dropped to $11.38B in 2023 (down 43% YoY). That means stricter diligence but opportunity for teams that demonstrate clear payback and operational execution.
Cybersecurity’s investment uptick amid rising breaches
Cybersecurity raised about $2.7B in Q1 2024 as breach costs rose—the average incident now runs about $4.88M. Buyers prioritize prevention, detection, and compliance tools with measurable ROI.
- Match metrics: use model performance for AI, take-rates for fintech, NOI or energy savings for proptech, and cost-per-incident avoided for cyber.
- Lock pilots: secure pilot customers with clear value hypotheses to shorten sales cycles.
- Hire smart: hire ML engineers, AML/risk specialists, real estate ops, or security researchers depending on your sector proof points.
Fintech by the numbers: startups, unicorns, and investment value
The data below maps how fintech scaled across regions and what that means for your plan. You’ll get counts, market size, unicorn context, and investment swings so you can position growth and valuation ambitions clearly.
Startup counts by region and growth since 2019
Global counts jumped from about 12,211 in 2019 to nearly 30,000 fintech startups in 2024. That sharp increase raises product differentiation and go-to-market pressure.
Regionally, the Americas led with 13,100, followed by EMEA at 10,969 and APAC at 5,886. Use these regions to prioritize customer targets and investor outreach.
U.S. market value and CAGR outlook
The U.S. fintech market was valued near $4 trillion in 2024 and projects an 11% CAGR to 2028. That growth supports larger TAM narratives but also demands clear unit economics.
Unicorn landscape: Stripe and regional leaders
There were about 381 fintech unicorns by end-2024. Stripe sits among the largest, with a reported valuation of roughly $65–70 billion. Use these comps to set realistic valuation targets for late-stage rounds.
Annual investment swings and what they signal
Investment value peaked at $229.6B in 2021, eased to $118.2B in 2023, then recovered to $210.6B in 2024. These cycles—seen in global venture and venture funding—signal that prudent pacing matters.
- Match your category: infra and B2B enablement often weather cycles better than consumer neobanks.
- Defend your moat: compliance, fraud controls, and risk tools are durable differentiators.
- Plan efficient channels: B2B2X partnerships lower CAC and extend runway during investment pauses.
Unicorns, valuations, and the path to $1B+
Reaching a billion-dollar valuation is rare, and the league table shows why the bar sits so high. There are over 1,400 private, venture-backed unicorns globally; some counts place totals at about 1,542.
Global unicorn counts and U.S. dominance
The U.S. leads by a wide margin. San Francisco hosts roughly 256 unicorns and New York about 119. Proximity to capital, talent, and large customers helps explain that edge.
Top-valued private companies and changing league tables
Use today’s comps to calibrate scale: SpaceX (~$350B), ByteDance (~$330B), OpenAI (~$300B), Stripe (~$65–70B), Databricks (~$62B).
Why far fewer than 1% become unicorns
Far fewer than one percent of startups hit this mark because durable valuation needs margins, governance, and clear customer economics. You should align milestones to retention, cash efficiency, and category leadership — not vanity metrics.
- Calibrate asks with realistic comps and dilution plans so your cap table works at scale.
- Consider profitable independence or strategic exits as valid paths to long-term success.
- Watch cycle shifts and time a raise to public windows if an IPO is part of your plan; learn the current unicorn landscape.
As a founder, focus on repeatable unit economics and operational rigor to attract venture capital and long-term growth.
Deal mechanics: median rounds, cadence, and dilution trade-offs
Anchoring your plan to real medians makes negotiations clearer and keeps your board aligned.
Median benchmarks: a typical Series A in the U.S. centers near $18 million, while a Series C averages about $50 million (2024). Use these figures to size the round you model and to set realistic milestones.
Plan for roughly two to three years between funding rounds. Series A and B often close faster than Series C, so match hiring, marketing, and product milestones to that cadence to avoid a cash crunch.
- Benchmark your raise to the $18M Series A and $50M Series C medians to guide dilution and board expectations.
- Weigh dilution versus acceleration and focus on key terms: liquidation preferences, participating preferred, pro rata rights.
- Keep a dynamic data room and weekly KPI cadence to shorten diligence and reduce time to close.
- Use scenario planning for a minimum viable round, option-pool timing, bridge strategies, and a tight meeting rhythm.
- Target the right investor segments—seed funds, multi-stage, or growth—to match your stage and term appetite.
Practical rule: size your next round to hit two years of runway beyond planned hiring and experiments.
The gender gap in venture funding: what the data says
The money trail for female founders reveals both gaps and fast-moving signals.
Female-only teams captured just 0.9% of U.S. VC in Q2 2025. That compares with ~2.0–2.1% across 2022–2024. By contrast, mixed-gender teams took 40.9% in Q2 2025, up from 16.7% in 2022.
Female-only and mixed founding teams’ VC share over time
These numbers show a persistent allocation gap you must navigate. In 2022 male founders raised about $156.2B vs. $28.1B for female founders. Use that context when planning outreach and comps.
Female founders’ exits and momentum indicators
There are signs of progress. Female founders accounted for 24% of VC exits in 2024. That outcome helps you make a stronger exit case when talking with investors.
- Target investors who back female founders or mixed teams to shorten your path to a lead check.
- Build revenue and pilot evidence to pre-empt bias and highlight market proof.
- Use non-dilutive capital and advisory hires to extend runway while you scale.
Practical point: show comparable KPIs and a clear path to exit—momentum matters in 2026.
Founder profile trends: age, team structure, and salaries
Founder demographics are shifting, and age now matters more than the myth of “young genius.”
The average founder is about 42 years old. The fastest-growing 0.1% show a slightly higher average of 45. Data even suggests a 60-year-old often has better odds of success than a 30-year-old because of experience and networks.
Team size and co-founder advantages
Two founders usually outperform solos. Teams with two founders raise roughly 30% more and post about 3x the customer growth. Co-founders reduce execution risk and temper over‑ambitious scaling.
That said, shared ownership adds governance complexity and requires clear role splits up front.
Compensation and retention benchmarks
In 2024 the average founder salary sat near $142,000. Founder‑CEOs averaged about $148,000, with top-paid CEOs reaching $300,000 at later stages. Align pay to stage and runway so you keep talent without burning cash.
Practical checklist for building leadership
- Cover product, go‑to‑market, and finance early; many companies skip a CFO at first.
- Design option pools with cliffs and standard vesting to attract tech and software hires.
- Keep roles flexible but avoid gaps in critical responsibilities.
- Use advisors and mentoring to close experience gaps cheaply and fast.
- Measure success with retention, margin, and roadmap velocity—not vanity metrics.
Quick point: co-founders and a balanced leadership team are among the most practical levers you can pull to increase your odds of long-term success.
Industry risk signals: failure rates, product-market fit, and cash flow
Failure signals in industries often arrive slowly, then compound quickly.
About 90% of startups fail, and roughly 10% fold within the first year. The leading cause is lack of product-market fit at 34%.
Marketing execution is the second frequent cause (about 22–29%). Poor segmentation and weak messaging drive many of those misses, not always budget.
Top reasons and sector-specific risk
Industry failure rates vary: IT shows ~63% over a decade, while retail and construction exceed 50%.
Cash flow problems contribute to 82% of business failures — a dominant cause across sectors.
Cash flow and capital efficiency as survival drivers
You’ll make cash flow discipline non-negotiable. Build weekly visibility and contingency plans so you can react in time.
- Prioritize PMF: validate willingness to pay early to reduce the 34% risk.
- Measure capital efficiency: run cheap experiments to learn faster and preserve runway.
- Stage metrics: use qualitative signals pre‑PMF and cohort profitability post‑PMF to guide investments.
Use this data to tailor your risk lens by industry and to time larger investments only after clear repeatability.
Market headwinds and tailwinds shaping funding terms
Macro shifts this past year rewrote the risk calculus for many rounds. You should factor slower IPO windows, inflation, and geopolitics into timing and ask size.
Macro factors: inflation, geopolitics, and IPO windows
VC dipped in 2023 as investor caution rose amid public-market volatility and geopolitical shocks. Some 2024 data show a U.S. increase year-over-year, but that recovery is selective.
Investor caution, valuation resets, and term discipline
Expect investors to press harder on unit economics. Valuation resets and tighter preference stacks are common, especially in late-stage deals.
- Plan for volatility: avoid raising only when IPO windows look briefly open.
- Negotiate terms: know where to concede on participation and where to protect cap table upside.
- Keep lanes open: cultivate sector specialists, multi-stage firms, and corporate partners to balance speed and certainty.
Practical note: use 2024’s selective recovery to pace your raise—not to assume easy capital—and anchor valuation in comps and stage norms.
Data-driven playbook: how you can navigate the current funding market
Design a capital plan that maps traction to realistic round sizes and timing. Start with clear numbers: a median Series A near $18M, an average Series C around $50M, and roughly two to three years between rounds.
Align milestones to round medians and timelines
Turn benchmarks into a working model you can show investors. Outline the milestones that justify an ~$18M Series A and the stepwise progress toward a ~$50M Series C over 24–36 months.
Diversify capital and optimize burn
Don’t rely on a single path: combine angels, venture debt, revenue-based finance, and grants to reduce risk. Run a rolling 18-month runway plan with monthly burn updates and hiring gates.
Sector tactics for AI, fintech, and proptech founders
For AI, stress measurable productivity gains and inference cost control. For fintech, prove risk controls and compliance. For proptech, quantify NOI or energy savings to show payback.
- Build a KPI dashboard that tracks retention, CAC payback, gross margin, and pipeline health.
- Model dilution across scenarios and choose the path that preserves upside while enabling growth.
- Strengthen references—customers, advisors, and technical reviewers—to speed diligence.
Quote: “Use data to guide decisions, not as a post-hoc justification.”
What this means for you in the United States
Deciding where to compete in the United States shapes hiring, sales, and investor access.
Competing in major hubs vs. rising ecosystems
San Francisco hosts about 256 unicorns, while New York has roughly 119. That density matters for talent and follow-on checks.
East Coast hubs like DC and Boston are gaining momentum in healthcare and enterprise. Choose a base that matches your customers and sector focus.
Tuning your narrative to investor priorities right now
U.S. investors are prioritizing efficient growth, retention, and clear paths to profitability. Software and AI drew roughly 45% of capital, and the U.S. captured 64% of Q2 VC.
- You’ll target Silicon Valley for deep-tech and AI, and New York for fintech and financial buyers.
- Calibrate valuation to local comps and the current term discipline to avoid overpricing your round.
- Build a U.S.-centric reference list and mix remote and in-person meetings to keep momentum.
Practical note: maintain optionality across coasts and stages so you create competitive tension when you open your round.
Conclusion
You now have a clear data map to guide your next 90 days of planning and outreach. The key context: Q2 2025 saw global venture at $91B (−20% QoQ, +11% YoY), the U.S. holds 64% of VC, and AI grabbed ~28% of the quarter.
Use 2026 to align milestones to medians: a median Series A near $18M, an average Series C ~$50M, and roughly two to three years between rounds. Remember only 0.05% of startups raise institutional checks; most rely on self-funding or alternatives.
Act now: protect runway, sharpen your unit economics, and build investor relationships early. Pick the right capital path and tailor your sector story to what investors pay for today.
For deeper context on the current landscape, see startup trends.