Last Updated on January 17, 2026
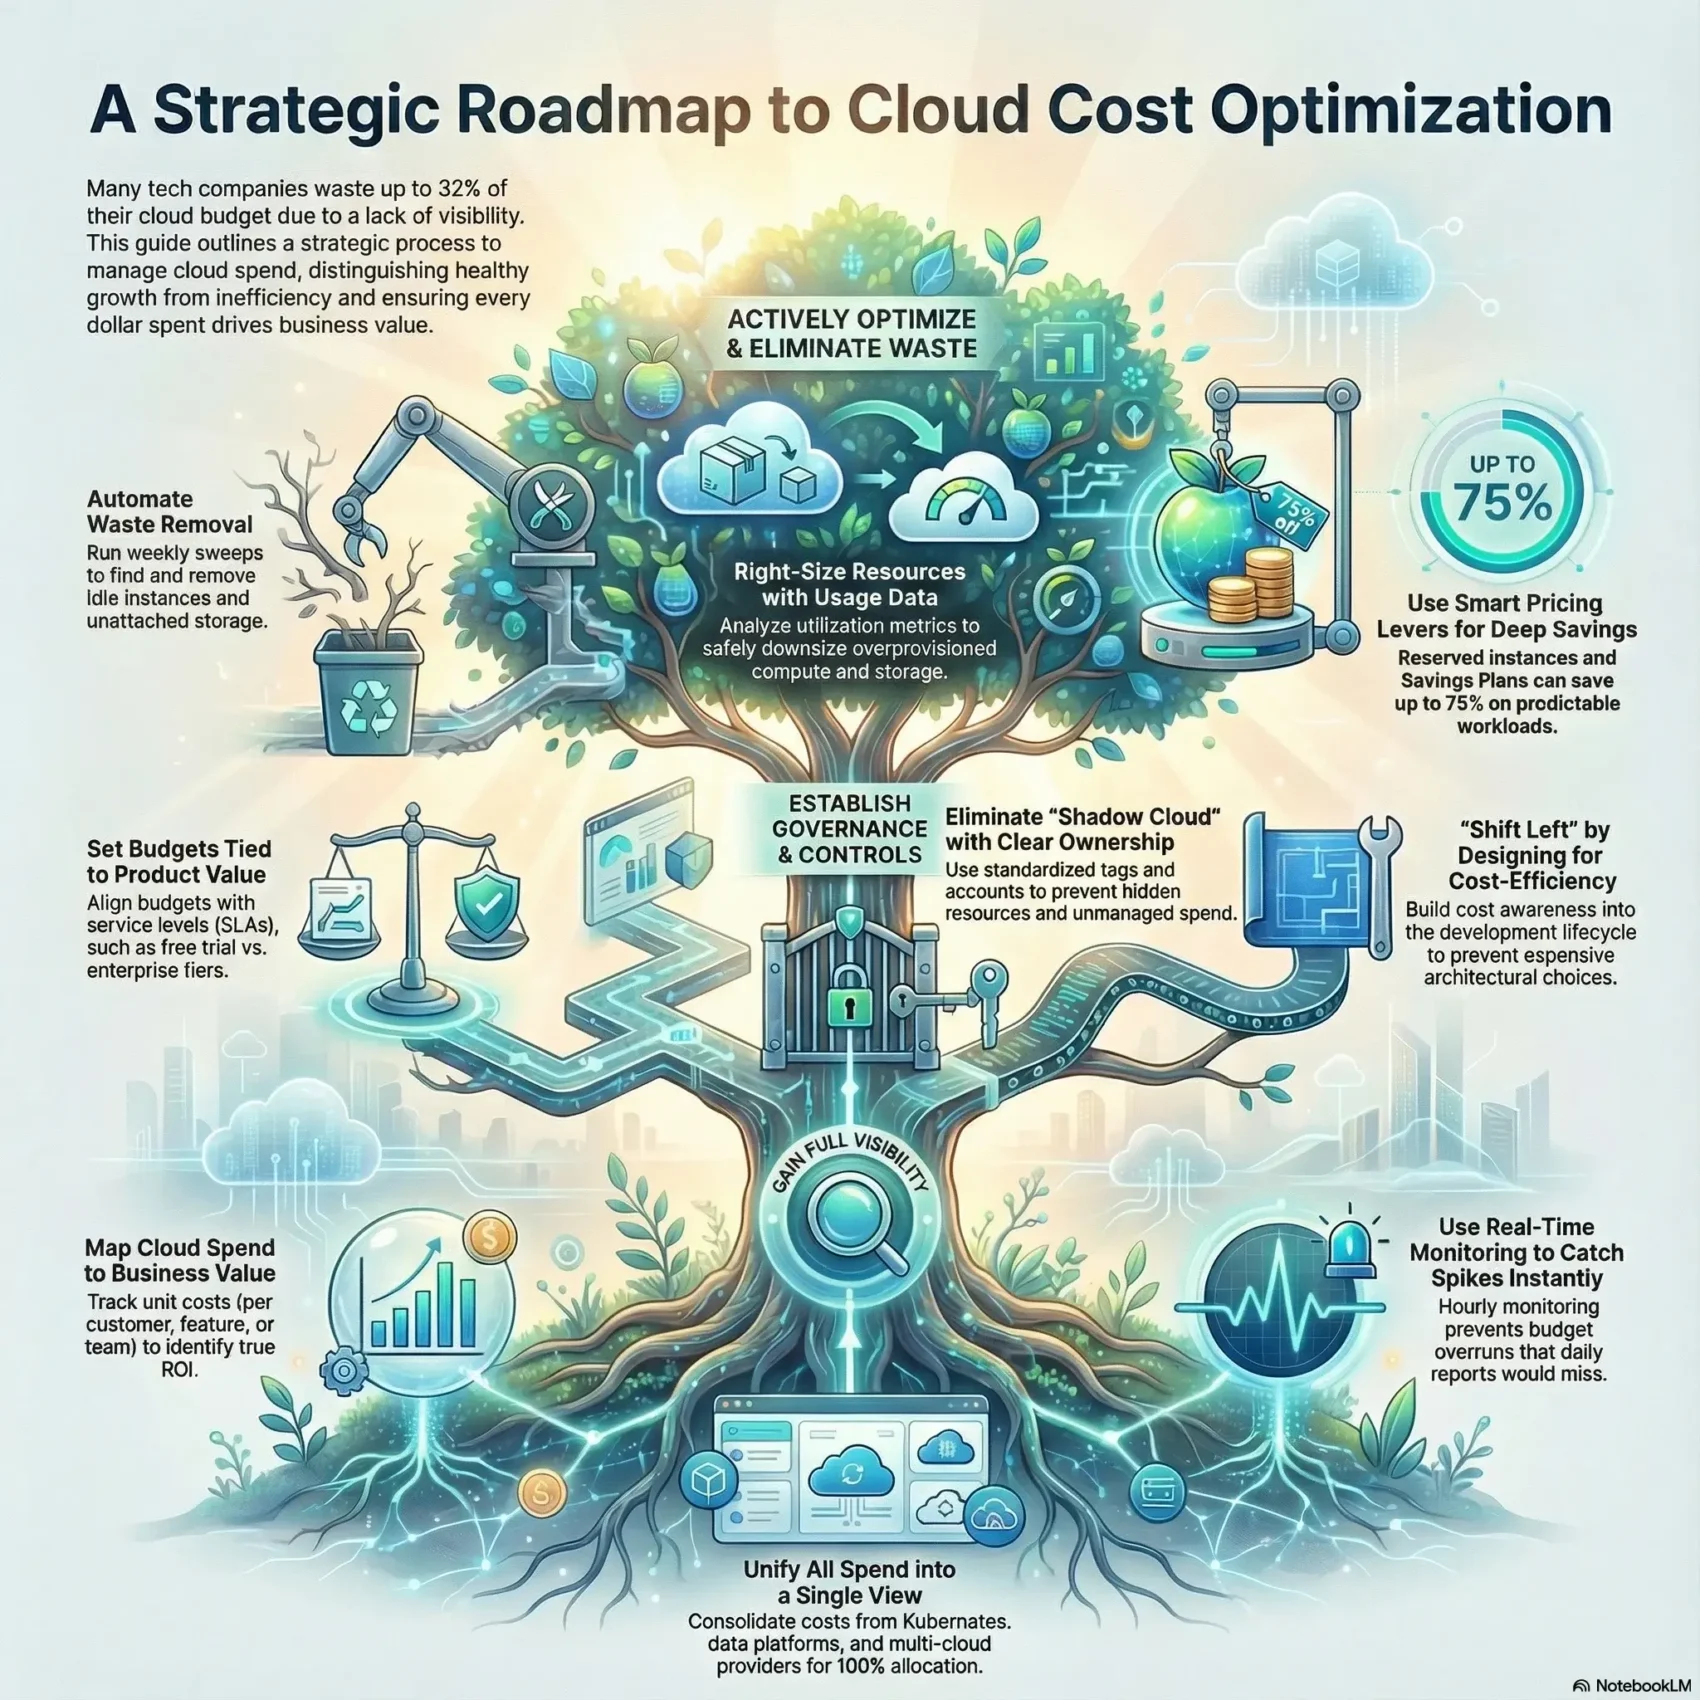
You need a clear roadmap to link spending to business outcomes. Many teams waste up to 32% of their budgets because they lack visibility into resources and data.
This guide frames cost management as a business conversation. You’ll learn how to tell healthy growth from waste, so your bills reflect value, not inefficiency.
Complex architectures like microservices and Kubernetes hide where cloud costs appear. Native consoles help a bit, but purpose-built tools and real-time data give the clarity your organization needs.
You’ll get practical steps to see, allocate, and manage spend across infrastructure and services. That lets you reduce cloud costs while keeping performance and velocity.
Key Takeaways
- Link spend to product and customer metrics to judge value.
- Use data and tools for real-time visibility across resources.
- Distinguish growth-driven increases from wasteful spending.
- Apply pricing levers and governance to protect margins.
- Set measurable goals and monitor anomalies before they grow.
Why Your Cloud Bill Keeps Growing: Mapping Intent to Action Today
Bills climb when teams add features faster than they track the resources those features consume. You can control many drivers of rising invoices today, but it starts with clear measurement.
Track unit economics — cost per customer, per feature, or per environment — to tell healthy growth from waste. Without that view, higher spend looks like a problem even when it supports product-led expansion.
Common cost drivers you can control right now
- Idle or unattached instances and unused resources left after tests.
- Oversized storage, verbose logging, and inefficient data transfer.
- Underutilized VMs and experiment-heavy engineering workflows.
When higher bills are healthy vs. when they signal waste
Higher spend is healthy if unit metrics improve — for example, more revenue per user or lower cost per feature.
Flag waste when usage rises but business signals don’t: sudden data growth with no customer lift, or hidden workloads that spin up without owners.
“Measure by unit cost, not by raw monthly totals.”
Use real-time tools and tight allocation to map each driver to a quick action: clean unused resources, right-size infrastructure, and set guardrail budgets to protect margins.
cloud cost optimization
When you map every workload to a business outcome, resource choices become strategic, not accidental.
Definition and goals. cloud cost optimization means matching the right compute, storage, and services to each workload so you meet performance, security, and compliance targets while avoiding waste.
This is not blunt cost cutting. Cutting without context hurts velocity and user experience. True practice uses metrics, monitoring, and unit economics to guide decisions.
Balancing performance, security, and compliance with spending
Set goals that rank priorities: where performance is non‑negotiable, where stricter compliance requires managed services, and where you can safely adopt serverless or smaller instances.
- Measure unit costs per feature, customer, or pipeline.
- Use monitoring and analytics to spot regressions in real time.
- Combine rightsizing and commitments with architectural shifts—like managed services or serverless—to meet targets.
“Optimization is continuous: workloads and providers change, so your strategy must evolve.”
For further trends and approaches, see cloud computing trends.
Gain Full Visibility and Allocate Costs to What Matters
Visibility turns billing into a business tool. When you map usage to customers, features, teams, and environments, every dollar links to value. That clarity helps you prioritize work and guide product tradeoffs without guesswork.
Unit economics: cost per customer, feature, team, and environment
Build simple unit views so leadership can see cost per customer, per feature, or per environment. These metrics make it easy to spot expensive features or teams that drift from goals.
Real-time intelligence vs. daily batch reports
Hourly allocation surfaces spikes fast. Daily batches miss short-lived anomalies that eat your budget and slow your product. Real-time insight lets engineers fix root causes before they compound.
Tagging, allocation, and showback that engineers actually use
Strong tagging and automatic allocation reduce friction. Adopt tags tied to teams and product IDs and pair them with showback or chargeback dashboards that engineers trust and act on.
Bringing Kubernetes, data platforms, and multi-cloud into one view
Unify spend from Kubernetes, Snowflake, Databricks, and multiple providers (including Google Cloud) into a single pane. That lets you allocate 100% of spend even across many instances and storage services.
- Map spend to product metrics so teams see impact.
- Use real-time tools to catch outliers quickly.
- Standardize tags and dashboards to drive adoption.
“When every resource maps to a business metric, decisions become measurable and repeatable.”
Establish Guardrails: Budgets, Governance, and Cost Culture
Strong guardrails help teams make predictable tradeoffs between feature speed and system resilience.
You should set budgets that reflect product packaging and SLAs, not arbitrary numbers. Tie a free trial tier to a different budget than enterprise offerings so day‑to‑day choices match revenue expectations.
Set meaningful budgets tied to product and SLAs
Make each budget reflect delivery speed, resiliency, and service levels. Use clear targets for trials, production, and high‑availability workloads.
Eliminate shadow cloud with standards and ownership tags
Standardize ownership tags and separate accounts for cost centers. That removes hidden accounts and forgotten resources.
- Budget by product and SLA so teams know tradeoffs.
- Ownership tags and accounts to stop shadow spend.
- Showback or chargeback with accurate data to drive accountability.
Pair budgets with alerts and lightweight governance tools. That flags overspend early and preserves performance, security, and savings over time.
“Guardrails keep your teams fast, accountable, and aligned with business goals.”
Eliminate Waste and Right-Size What You Run
A weekly hygiene sweep catches most waste before it shows up on the bill. Do short, repeatable checks to find unattached volumes, orphaned snapshots, and idle instances so you stop paying for unused resources.
Find unused and idle resources before the next billing cycle
Scan, tag, and act. Run an automated scan each week and surface items with near-zero utilization. Flag them for review, then archive or terminate safely.
- Identify unattached disks, idle instances, and long-lived dev environments.
- Automate safe deletion of orphaned snapshots and unattached volumes.
- Use native alerts (CloudWatch, Cost Explorer, Budgets) alongside third‑party tools for validation.
Rightsizing compute, storage, and databases with data-driven thresholds
Set thresholds on CPU, memory, and I/O to downshift overprovisioned instances and storage without harming performance.
Combine recommendations: use provider suggestions with tools like Densify, Virtana, or Cloudability to densify workloads and consolidate low-activity systems.
- Use utilization metrics to right-size and preserve performance.
- Apply capacity guardrails that scale up during spikes but keep steady-state costs lean.
- Automate recommendations into PRs or change requests to keep engineers in control.
“Targeted sweeps and data-driven rightsizing cut infrastructure waste while protecting customer experience.”
For trend context and tool options, see cloud computing trends.
Use Pricing Levers Wisely: Reserved, Savings Plans, and Spot
Not all commitments are equal — the right one depends on predictability and workload type. Start by classifying workloads as steady, spiky, or fault tolerant. That lets you match pricing levers to value rather than guesswork.
When to pick reserved instances versus Savings Plans
Reserved instances and Savings Plans can deliver up to ~70–75% savings with 1–3 year commitments. Choose reservations for stable, long‑running services and Savings Plans when you want flexibility across instance families and regions.
Use spot instances for batch, ML training, and fault-tolerant jobs
Spot instances are deeply discounted but interruptible. Run CI, batch pipelines, and machine learning training on spot to shrink bills while accepting occasional restarts.
Automate commitments and spot orchestration to reduce risk
Automation tools rebalance commitments, forecast usage, and orchestrate spot fallbacks. Tools like ProsperOps, Xosphere, and Spot by NetApp help you maximize savings while keeping performance within thresholds.
- Map workloads to on‑demand, reserved, or spot based on SLAs.
- Phase commitments using historic usage and roadmap forecasts.
- Measure realized savings and adjust as providers change pricing and services.
“Match purchase type to workload intent to unlock deep discounts without surprise interruptions.”
Optimize Storage and Network to Cut Hidden Fees
Small mismatches in where you keep files and how they move can create large, hidden bills. Fixing placement and transfer patterns reduces recurring spend without hurting performance. Start by mapping which datasets need fast access and which can be archived.
Right tier, right time: lifecycle policies and intelligent tiering
Match each dataset to the right storage tier and apply lifecycle rules so cold data moves automatically.
Use Intelligent Tiering (for example, S3 Intelligent Tiering) to avoid paying high rates for objects that you rarely access.
- Set lifecycle policies to transition or delete old snapshots and logs.
- Audit backups and adjust retention to sane levels that meet SLAs.
- Schedule periodic cleanups so growth stays predictable.
Limit egress and inter-region transfer with smart architecture
Keep chatty services and their data co‑located to cut transfer fees. Reduce inter-region traffic by design rather than by accident.
Evaluate dedicated links—Direct Connect, Interconnect, or ExpressRoute—or use physical transfer options like AWS Snowball for large migrations.
“Design placement and network paths first—pricing follows architecture.”
Track pricing signals from providers and tune retention, tiering, and topology to balance capacity and performance. With regular audits and simple lifecycle rules, you stop hidden fees before they start.
Shift Left in the SDLC: Build Cloud-Native, Spend Smarter
When you bake cost visibility into design, you prevent surprises later in the pipeline. Move budget thinking into planning so architecture choices deliver elasticity and efficiency by default.
Design for elasticity: use autoscaling, containers, and serverless patterns so infrastructure scales with demand. Autoscaling keeps instances idle time low and aligns spend with real usage.
Automated environment hibernation and teardown
Automate shutdowns for dev and test environments each night and on weekends. That simple practice cuts recurring waste while keeping teams productive during work hours.
Record data and set cost-aware non-functional requirements
Track usage by product, feature, and environment throughout the SDLC. Record metrics in sprint reviews so architecture decisions are informed by real data.
- Shift left so design tradeoffs include performance, reliability, and cost targets.
- Automate environment lifecycles to prevent drift and surprise bills.
- Enforce sensible limits on dev instances and apply short lifespans to test resources.
“Make small, automated guards part of your workflow so teams stay fast and costs stay predictable.”
Monitor in Real Time: Anomalies, Alerts, and Automation
When anomalies happen, minutes matter: your platform should spot and signal them before they compound. Real-time monitoring lets you stop spikes fast, not after the bill arrives.
Use machine learning-based detectors to flag unusual patterns automatically. AWS Cost Management and other native tools offer anomaly detection that learns normal behavior and warns when something breaks the pattern.
Machine learning to stop spikes quickly
ML models reduce noise by surfacing only true deviations. That means you catch errant jobs, runaway instances, or billing regressions within hours instead of days.
Proactive, actionable notifications
Send alerts with context — which resource, what changed, and who owns it. Wire those signals to budgets and policies so alerts escalate and automation can pause or scale down noncritical workloads.
- Hourly or real-time feeds prevent days of runaway spend versus daily reports.
- Automated playbooks let CloudWatch or other monitors trigger safe remediation on ECS/EKS clusters.
- Prioritized signals cut alert fatigue and close the feedback loop to improve forecasts over time.
“Real-time monitoring turns surprises into fixable incidents.”
Tools That Help You Reduce, Optimize, and Understand Costs
The right platform surfaces which services and instances drive value — and which don’t. Pick tools that give deep visibility, accurate allocation, and smooth integrations so your team can act fast.
How to evaluate tools
Focus on five things: visibility depth, allocation accuracy, integrations, usability, and total cost of ownership. Tools that miss one of these fail to earn adoption.
What top services bring
- CloudZero: per‑unit economics, hourly allocation, and anomaly detection across AWS, Azure, GCP, Kubernetes, Snowflake, and more. It helped Drift save $4M and Ninjacat cut 40%.
- Native consoles: AWS Cost Explorer, CloudWatch, Azure Cost Management, and GCP tooling offer budgets and alerts but limited business context.
- Specialized partners: ProsperOps for commitments, Xosphere and Spot by NetApp for spot orchestration, CAST AI for Kubernetes, and Finout for multi‑provider dashboards.
“Choose a mix that centralizes data, maps instances and storage to product metrics, and automates routine savings.”
Forecasting, KPIs, and Continuous Improvement
Forecasting by workload turns guesswork into planned action for your teams. Use historical usage and workload patterns to set realistic budgets and avoid surprise spend.
Forecast by workload with scenario planning
Analyze past usage per service, pipeline, or feature and build scenarios: steady‑state, rapid growth, and refactor‑led savings.
Model each scenario in tools like AWS Cost Explorer or Azure Cost Management so you can see how pricing changes or capacity shifts affect future budgets.
Track KPIs like cost per customer and gross margin impact
Measure business outcomes, not just invoices. Track cost per customer, unit costs, and gross margin impact to guide tradeoffs between spending and performance.
- Connect forecasts to pricing updates from providers and capacity plans.
- Revisit rolling forecasts on a set cadence and tie alerts to anomalies for immediate adjustment.
- Align teams around targets and iterate: review, learn, and improve continuously.
“Turn forecasting into a feedback loop: predict, monitor, adjust.”
Conclusion
Wrap up by making spend a measurable lever that guides product choices and team tradeoffs.,
Turn visibility into action. Link unit metrics to features and users so your team knows which work drives value. Use rightsizing, commitments, spot automation, and governance to reduce cloud costs without harming performance.
Keep teams aligned with budgets, alerts, and clear best practices. Forecast regularly, measure unit outcomes, and iterate so expenses track growth instead of eroding margins.
Choose tools and partners that give real-time visibility and automate safe savings. That lets your organization scale wins and keep investing in features customers love.