Last Updated on December 13, 2025
You are standing at a major turning point in how teams use data and intelligence to make decisions. Investment is rising fast: the big data market may hit $103 billion by 2027, and the data analytics market could reach $132.9 billion by 2026. More than 90% of organizations saw clear value from their data work in 2023, and 3 in 5 now use insights to spark innovation.
This section gives you a simple roadmap to align your strategy with these trends. You’ll learn where to place bets, which capabilities to build, and how to turn raw data into action your users can adopt quickly. Companies that act now often win higher productivity and faster growth.
Read on to map steps that scale intelligence across teams while keeping risk in check. For a deep look at predictive uses, see a practical guide to predictive tools here.
Key Takeaways
- Market momentum means early moves capture outsized value.
- Practical intelligence turns data into usable insights.
- Focus on speed, trust, and scale when you build capabilities.
- Use proven use cases to drive team adoption fast.
- Balance growth with clear risk controls to protect users.
Why the future of business analytics matters now
The scale and speed of data investment today mean you can’t wait to modernize how your teams learn from information. Market signals show clear returns for leaders who act now.
User intent and what you’ll gain
You want clear priorities, fast. This report gives a short roadmap you can use to win support and unlock funds. It explains which capabilities to build first and which quick wins deliver measurable value.
Market signals shaping decisions
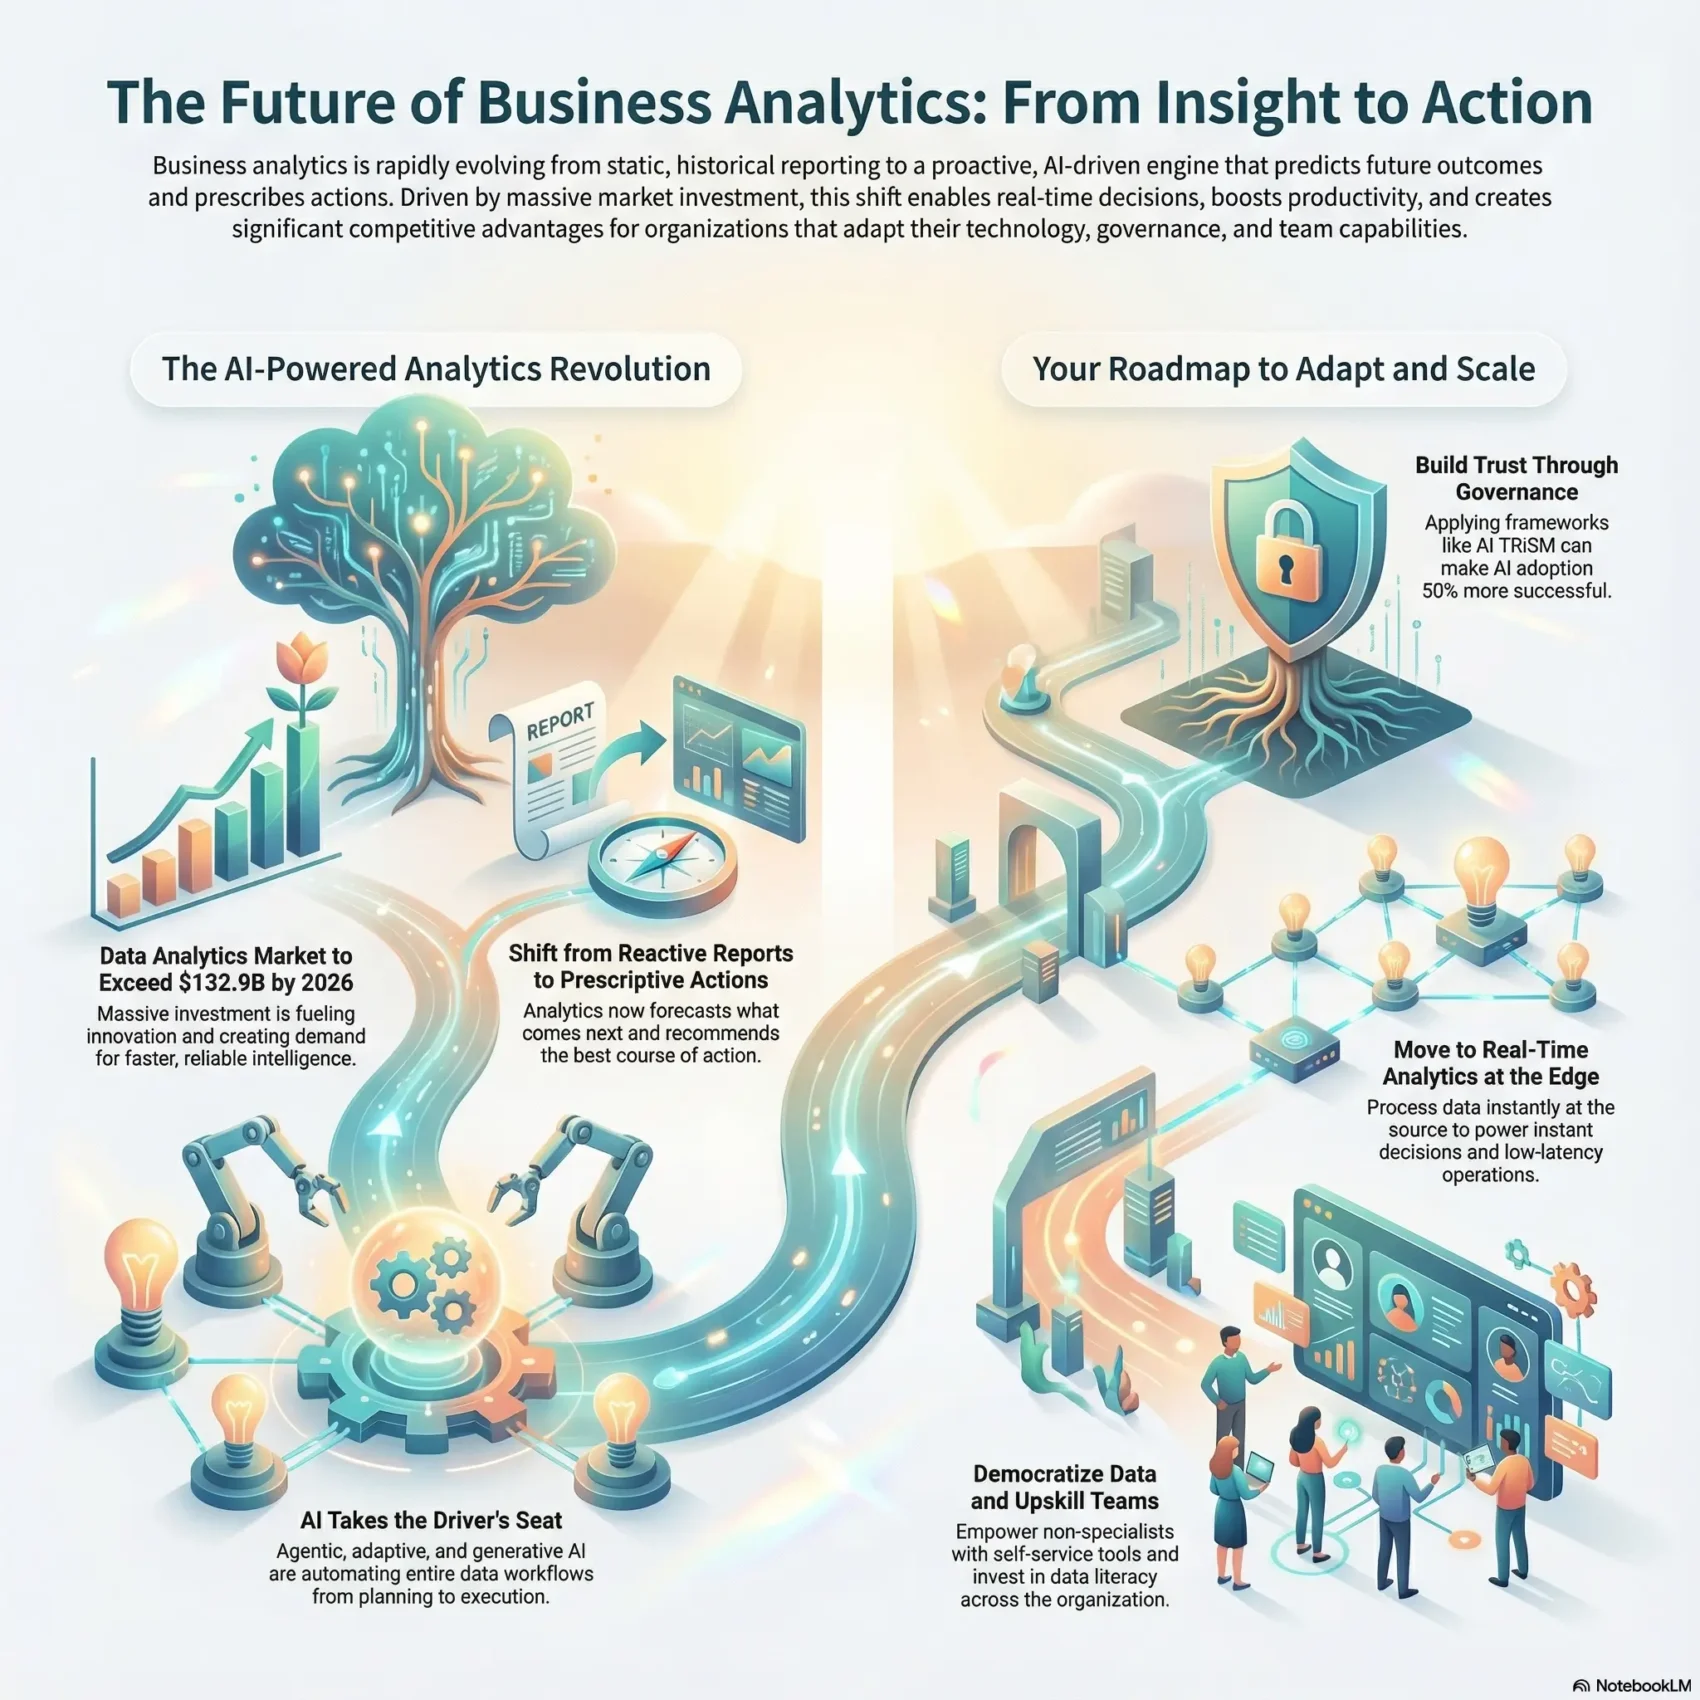
Global spending on analytics is set to top $132.9 billion by 2026, while big data may exceed $103 billion by 2027. Three in five organizations now use insights to drive innovation, and over 90% saw measurable value in 2023.
- Data-driven choices link to a 63% productivity lift.
- Kearney finds an 81% profitability boost from advanced analysis.
- McKinsey ties customer analytics to at least 50% gains in growth and profit.
Bottom line: these signals mean higher demand for reliable intelligence and faster time-to-insight. Use this report to prioritize work that your teams and customers actually need.
Macro shifts redefining analytics strategy beyond 2026
Teams are shifting from rearview reports to playbooks that forecast risk and prescribe action. This move uses historical data to run scenario simulations and surface recommended next steps. You get faster, clearer choices when models suggest actions, not just list outcomes.
From reactive to predictive and prescriptive decision-making
Predictive analytics spots what comes next; prescriptive tools tell you what to do. Use models for risk scoring, demand forecasting, churn intervention, and dynamic resource allocation.
Decision intelligence and data storytelling replace static reporting
Decision intelligence blends quantitative signals with expert judgment and operational context to improve decisions. Data storytelling replaces static charts with narratives that explain the “why,” not just the “what.”
“Short learning loops that test hypotheses and tune models will make your work resilient to change.”
- Scale analysis beyond specialists so users act in real time.
- Prioritize faster learning cycles to keep models accurate.
- Measure decision quality, speed, and impact to prove value.
AI takes the driver’s seat: Agentic, adaptive, and generative capabilities
AI is moving from helper to operator, taking on planning, execution, and course-correction across data workflows. That shift means your teams can rely on software to run routine tasks, freeing people to focus on strategy.

Agentic AI plans tasks, executes steps, and self-corrects. By 2028, roughly a third of enterprise software apps may include these agents, automating report generation, data quality checks, KPI monitoring, and scenario playbooks embedded in software.
Adaptive models that learn in real time
Adaptive AI keeps models fresh as market signals shift. You get faster decisions because models adjust without constant manual retuning.
Generative intelligence for richer insights
Generative capabilities upscale analysis. They surface drivers, segments, forecasts, and anomalies automatically and power assistants that answer questions in plain English.
“63% of executives expect their AI portfolios to impact financial results within two years.”
- Agentic systems automate end-to-end workflows in software.
- Adaptive models improve resilience and accuracy as conditions change.
- Generative tools speed investigations with charts, narratives, and recommended actions.
Plan guardrails—data quality, model governance, and risk limits—so these capabilities scale safely in the real world.
Frontier tech enablers: Quantum, AR/VR, and immersive dashboards
Cutting-edge compute and immersive displays are changing how teams solve hard optimization and see multi-dimensional data. You’ll want to know when these technologies move from lab demos to real applications that drive measurable outcomes.
Quantum-assisted optimization for complex portfolio and routing problems
Quantum computing helps solve combinatorial problems that slow traditional processing. Think portfolio rebalancing, vehicle routing, network flow, and supply planning.
Where to pilot: pick constrained problems with clear KPIs and run quantum solvers alongside classical algorithms to compare results and speed.
AR/VR data visualization to accelerate insight comprehension
Immersive dashboards turn dense data into spatial stories. Real estate teams already overlay market trends on physical sites to speed decisions.
“Immersive interfaces cut cognitive load and help non-technical users see patterns they would miss in flat charts.”
- Identify processing bottlenecks where quantum can shorten time-to-insight.
- Design pilots tied to market metrics so experiments show clear ROI.
- Consider integration needs: data quality, model pipelines, and user readiness.
Plan adoption carefully. Balance innovation with governance, user training, and measurable pilots so these enablers actually lift your teams and users.
Governance you can trust: Ethics, XAI, and AI TRiSM
Strong governance turns clever tools into trusted tools your teams will actually use. You need policies that cover data from collection through model deployment and monitoring. GDPR, CCPA, and LGPD set the privacy baseline that your program should meet.
Enhanced data governance for GDPR/CCPA-era compliance
Embed privacy-by-design so compliance accelerates your roadmap rather than slowing it. Define roles, controls, and versioning so organizations know who owns what and how issues are remediated.
Explainable AI to satisfy regulated sectors and stakeholder trust
Adopt XAI methods so stakeholders understand predictions and decisions. Clear explanations boost acceptance and lower operational risk in regulated environments.
AI TRiSM: Model governance, fairness, resilience, and adoption at scale
Use AI TRiSM to enforce fairness, robustness, and resilience. Standardize model management—versioning, drift detection, and human-in-the-loop escalation—to protect value and support rapid adoption across your organization.
- You’ll define policy, roles, and controls from data creation to deployment.
- You’ll standardize model management and change management processes.
- You’ll measure trust and transparency as first-class outcomes to scale analytics across the business world.
“Organizations applying AI TRiSM are expected to be 50% more successful in adoption, goals, and user acceptance.”
Real-time analytics at the edge
Streaming event platforms like Apache Kafka let you react to live signals in milliseconds. This reduces lag between capture and action so teams can make instant decisions where delays cost revenue or safety.
Streaming data processing to power instant decisions
Build streaming pipelines that capture events, enrich them, and update state in near real time. Retailers change prices during demand spikes. Hospitals reallocate staff during surges using the same flow.
Edge computing for low-latency operations
Place compute close to the source so sensors and machines get fast responses. Edge nodes run lightweight models and keep critical operations running even with flaky networks.
Automated decision-making: dynamic pricing, inventory, and routing
Operationalize models to push automated updates—pricing, inventory balancing, and routing—without manual steps. Integrate software that scales ingestion and stateful processing across cloud and edge while keeping costs predictable.
- You’ll build pipelines that act in milliseconds to power instant decisions.
- You’ll harden systems to handle bursts, noise, and partial failures at the source.
- You’ll design observability with real-time KPIs so operations stay stable as volumes grow.
- You’ll prioritize industries and sites where edge power gives the biggest lift.
To explore deployment patterns and governance, see the edge AI playbook for practical steps you can adopt today.
Cloud, data fabric/mesh, and cost optimization
When platforms scale, your priority shifts from hosting servers to curating reliable data products for teams. You need patterns that connect distributed datasets while keeping control and cost predictable.
Data fabric and data mesh to unify distributed teams
Data mesh decentralizes ownership so domain teams publish trusted products. This reduces bottlenecks and speeds time-to-insight across organizations.
Define domain ownership, simple governance rules, and discoverability so teams can access and trust shared outputs. Standardize a small set of tools and software choices to balance flexibility with platform reliability.
Cloud cost controls: right-sizing, autoscaling, and value tracking
Implement rightsizing and autoscaling to cut waste without slowing work. Pair workload scheduling with value tracking so you tie spend to measurable outcomes.
- You’ll connect distributed data so teams discover, access, and trust shared products.
- You’ll embed financial management to monitor usage and allocate costs by product.
- You’ll document strategies for migration, modernization, and refactoring to avoid runaway complexity.
- You’ll enable self-service while keeping guardrails that protect sensitive data and compliance.
“Align platform roadmaps with teams so impact is visible and momentum compounds.”
Security-first analytics: Zero Trust and cybersecurity mesh
Security needs to be baked into every data pipeline so your teams can trust what they build. Global spending on information security is set to hit $212 billion by 2025, yet only 54% of CEOs feel prepared for an attack. That gap matters when threats evolve.

Start with continuous verification. Implement Zero Trust to validate every user, device, workload, and API request. Adoption is rising; large enterprises are expected to increase uptake markedly by 2026.
Zero Trust: Verifying every user, device, and workload
Apply least-privilege access, tokenization, and encryption in motion and at rest. Harden pipelines so models and reports run only on trusted inputs. Formalize incident response, key rotation, and continuous posture checks to cut risk.
Cybersecurity mesh to protect multi-cloud, SaaS, and edge assets
Use a modular mesh to place controls near assets across cloud and edge. Studies show this approach can shrink incident cost by roughly 90% when done right. Test tools and software that integrate with your stack without slowing insight delivery.
- Align organizations with shared security metrics and governance.
- Design controls for AI-enabled threats and adversarial tests.
- Build the investment case by tying risk reduction to continuity and customer trust.
Industry applications and outcomes to watch
Targeted pilots show where investments move metrics fastest. Map high-ROI use cases across industries so you can prioritize pilots that deliver clear outcomes and rapid adoption.
Healthcare: AI diagnostics, predictive care, and IoMT monitoring
Healthcare teams use AI to read medical imaging with high precision and to predict patient needs. Real-time IoMT monitoring and cloud data sharing—used by over 70% of providers—cut readmissions and speed interventions.
Banking & finance: Risk analytics, fraud detection, and tailored products
In finance, advanced analytics improve credit risk scoring and fraud detection. Banks that operationalize these models report >20% revenue lift over three years by delivering personalized customer services at scale.
Insurance: Telematics, hyper-automation, and trustworthy AI
Insurers apply telematics and hyper-automation to price risk and speed claims. Explainable AI builds trust and can raise agent productivity by as much as 130% while keeping regulatory scrutiny in check.
Manufacturing: Digital twins, predictive maintenance, and edge analytics
Manufacturers deploy digital twins and edge intelligence for predictive maintenance. Early industrial metaverse pilots improved efficiency and quality by roughly 12%, cutting downtime and cost.
Retail and eCommerce: Hyper-personalization and streaming insights
Retailers use streaming data for dynamic pricing and hyper-personalized offers that respond to demand in real time. These applications lift conversion and boost customer lifetime value when paired with fast operational feedback loops.
- Map use cases to outcomes: experience, efficiency, and revenue.
- Prioritize pilots: pick sites where impact, measurability, and adoption converge.
- Build cross-functional teams: connect product, data, and operations to turn insights into action.
“Start small, measure impact, and scale what proves repeatable.”
How you adapt: Capabilities, tools, and operating models
To make data work for everyone, you need clear capabilities, simple tools, and an operating model that scales. Start small, prove value, then expand patterns that repeat across teams.

Democratized analytics: self-service, no-code/low-code, and training
Self-service platforms like Tableau let teams explore data without waiting on specialists. No-code and low-code tools widen access while reducing delivery bottlenecks.
Pair tools with guardrails: role-based permissions, templates, and simple review flows stop misinterpretation and keep quality high.
Data literacy for professionals and cross-functional collaboration
Invest in capability building—data analysis basics, product thinking, and decision intelligence skills. Short, role-based learning paths fit into regular work so professionals grow while delivering value.
Create collaboration rituals—shared backlogs, office hours, and playbooks—to reduce handoffs and speed delivery across product, data, and operations teams.
Prioritization roadmap: quick wins, scaling, and governance by design
Map a roadmap that targets early wins tied to clear KPIs. Stand up self-service with the right tools and software, then scale what shows measurable value.
- You’ll define access strategies that remove friction while honoring governance and compliance.
- You’ll connect platform management with product teams so ownership and feedback loops stay fast.
- You’ll embed learning into workflows and track value so leaders see where to double down.
“Democratize access, then govern the results—this balance turns tools into repeatable value.”
Conclusion
Turn signals in your stack into repeatable wins by pairing dashboards and tools so teams get faster, clearer analytics and actionable insights.
Start with measurable pilots that cut costs and prove value. Agentic AI adoption will rise to 33% in enterprise apps by 2028, and streaming platforms like Apache Kafka power real-time work that moves decisions from slow to instant.
Guardrails matter. Deploy Zero Trust, AI TRiSM, and a security mesh to protect access and reduce incident impact—cybersecurity spend nears $212 billion by 2025 and risks include generative AI attacks.
Focus where demand, cost, and power meet: predictive analytics, edge processing, and adaptive models. Track outcomes, share wins, and scale what actually helps your customers and organizations grow.