Last Updated on December 13, 2025
Where does output stand today, and what should you do next? Recent data show a notable surge: productivity growth averaged about 3.6% annualized in the U.S. nonfarm business sector across the last three quarters of 2023.
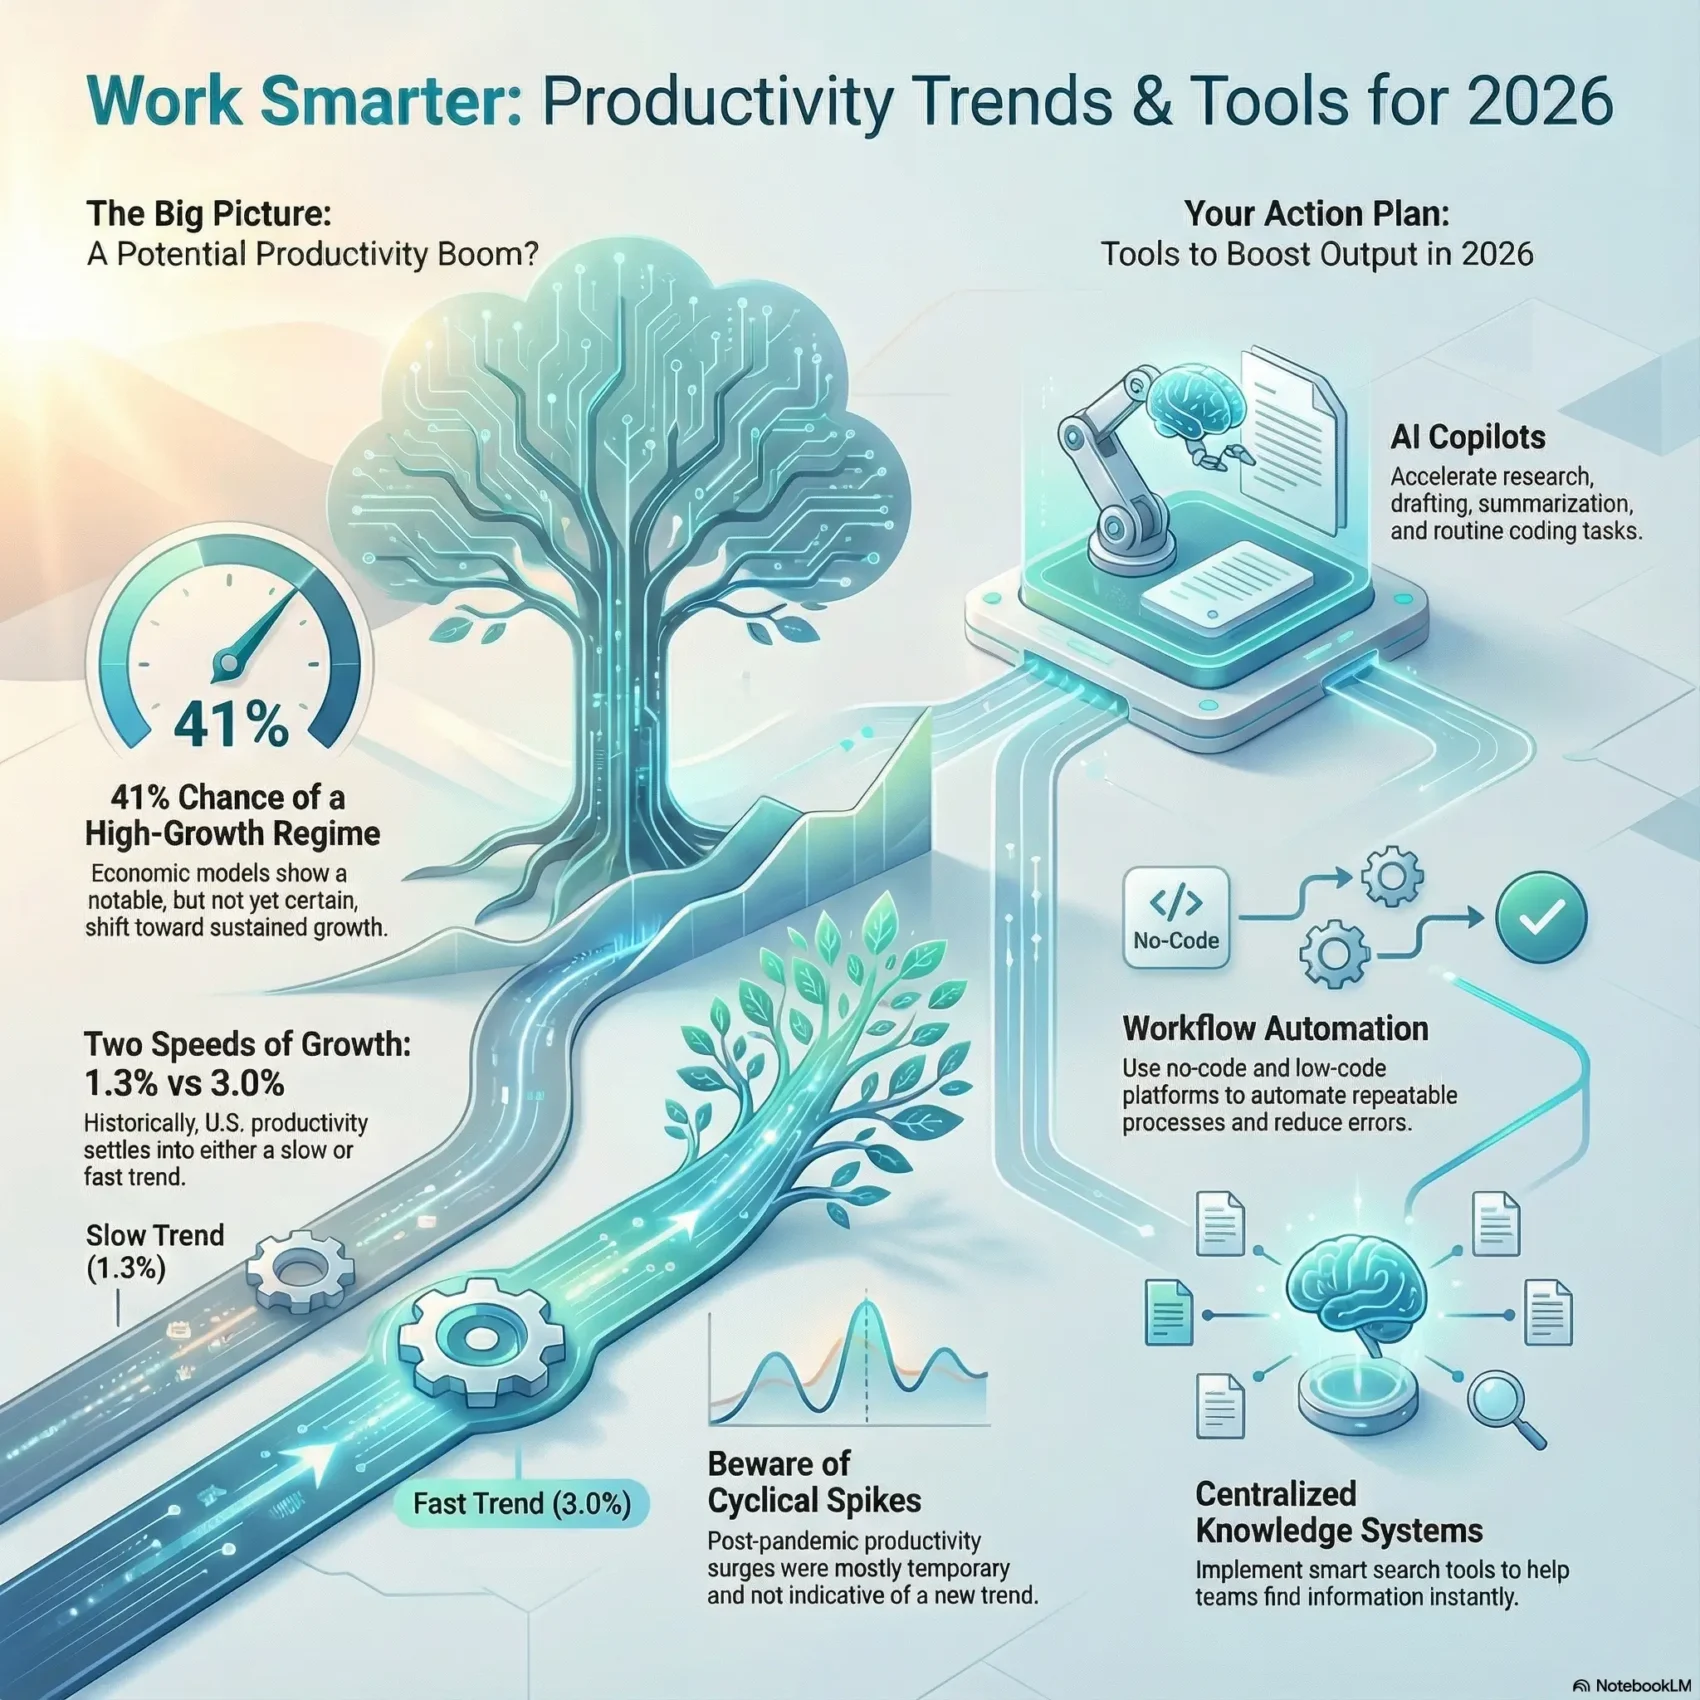
Researchers using a regime-switching model put the chance of a sustained high-growth phase near 40–41%. Long-run regimes center near 1.3% and 3.0% trend growth, so you need to tell durable gains from short swings.
FRBSF work and BEA revisions show pandemic-era spikes, a partial reversion, and then slightly above-trend readings after mid-2023. That matters because official information can change the story overnight.
In this guide, you’ll get a clear snapshot of the united states context, the meaning of trend versus cycle, and practical tools and technology to lift output in 2026 without chasing hype.
Key Takeaways
- You’ll see where productivity stands now and why recent growth matters.
- Learn how researchers separate short swings from trend changes.
- Find tools and technology that deliver measurable gains in 2026.
- Understand how BEA revisions and data updates affect planning.
- Get action steps to align time, budget, and talent with long-run goals.
Why Productivity Trends Matter Now: Your Snapshot for the United States
You need a short, practical view of how output per hour worked affects living standards and wages in the United States. Start with the core definition: labor productivity equals real output per hour worked, combining BEA output and Bureau of Labor Statistics hours.
What the measure captures
Labor productivity links directly to gains in GDP and higher pay for workers when growth is sustained. Small annual rate shifts compound over years, so even modest productivity growth changes alter long-term income paths.
The recent context
Post-pandemic rebounds, plus BEA’s September 2024 updates, raised post‑2019 output. BLS hours series also moved. Together these revisions lifted measured growth by about 0.21 percentage points annualized since 2019:Q3.
- What to watch: headline growth versus cycle-adjusted rates.
- How to use the data: benchmark your teams against historical phases.
- Practical tip: focus on per-hour gains that persist across revisions.
What the Latest Data Say: Are We Entering a High-Growth Productivity Regime?
Statistical filters now flag a meaningful probability—about 40–41%—that growth has shifted upward. That signal comes from a regime-switching model applied to U.S. labor series through 2024:Q3. The model identifies two long-run trend states near 1.3% and 3.0%.
The November 2024 NIPA revisions and preliminary 2024:Q3 readings lifted measured output and per hour worked. Those revisions raised labor productivity growth by roughly 0.21 percentage points since 2019:Q3 and nudged the model toward the faster state.
How to read the signal
The current ~40–41% probability is notable but not decisive. Historical shifts—like the late‑1990s acceleration and the mid‑2000s slowdown—were recognized only after about two years.
That lag matters for planning. You can model scenarios around the 1.3% and 3.0% benchmarks, factor in revisions to consumption and real compensation, and keep investments staged. For guidance on adapting work and roles as automation picks up, see job automation adaptation.
- Practical takeaway: treat the signal as a meaningful input, not a certainty.
- Plan: set staged investments and monitor incoming data closely.
Pandemic Boom-and-Bust: Cyclical Surges vs Trend Productivity Growth
A dramatic fall in hours worked and a shift toward capital-heavy industries pushed measured per-worker output up in 2020. That spike looked large but owed much to short-run composition and supply effects rather than a permanent shift.
Labor output and unemployment: a predictable cyclical link
The four-quarter change in unemployment predicts cyclical swings in output per hour well. When layoffs rose, average worker experience increased, lifting measured output.
In practice, output per hour tends to rise as unemployment jumps and then cool as hiring resumes and hours recover.
Decomposition: TFP, capital deepening, and labor composition
Three short-run factors drove the 2020 surge. First, labor composition improved because fewer inexperienced workers were employed.
Second, capital deepening rose as the same capital served fewer workers. Third, total factor productivity spiked with higher work intensity early in the recovery.
Why the 2020–2024 spikes were temporary — and what stayed slightly above trend
As hours and hiring normalized, composition and intensity effects faded. Reopening shifted activity back toward service sectors, reversing some gains.
- Temporary: composition and supply-driven boosts that revisions later trimmed.
- Persistent: modest gains where firms invested in automation and capital.
- Lesson: treat cyclical gains as non-recurring when you set targets.
productivity trends
Across postwar decades, U.S. output per hour shifted between higher and lower trend phases. Those phase breaks—notably around 1973, 1997, and 2005—anchor how you compare long-run performance over time.
Small changes in measurement and later revisions can move the narrative. Recent updates raised post‑2019 estimates and nudged models toward a faster-growth state, though odds remain below even.
What matters for your planning is the distinction between short-run swings and durable change. Use multi-year averages to avoid chasing quarter-to-quarter noise.
- Watch the break years: they set baselines for long comparisons.
- Use staged decisions: align hiring and capex with scenario ranges, not single readings.
- Anchor on labour productivity: it remains the clearest series to brief stakeholders.
In short, treat recent gains as a meaningful signal, not a guarantee. Keep plans flexible and rely on revision-aware metrics when you set budgets and timelines.
Global Patterns vs U.S. Outliers: What the Cross-Country Evidence Shows
Cross-country tests show a shared, long-run slowdown that you should factor into planning. Structural break checks across 25 countries find many breaks in the 1970s and another cluster from 1995–2005. The common path is downward, steeper in Europe, while the U.S. sits above many peers but below the late‑1990s pace.
Common components and statistical evidence
Principal component analysis finds a single factor explaining over half the variance in 21 of 25 series. That means shared forces, not isolated shocks, drive much of the pattern.
Growth leads output: causality and interpretation
Granger tests in recent economic research indicate gdp trend tends to lead labour productivity trends. For you, that implies demand and scale often set the stage for measurable gains.
What this means for business and capital decisions
Industries and capital intensity shape cross-country differences, but gaps are modest. Use regional clusters (Anglo‑Saxon, Nordics, continental) as an example to set realistic benchmarks for investment, supply chains, and hiring.
- Takeaway: treat global shifts as system-wide constraints.
- Plan: align capital deployment with demand signals, not single-year jumps.
- Benchmark: use international factor evidence to set staged goals.
Mismeasurement and Intangibles: Are Official Statistics Understating Productivity Gains?
Official series sometimes underreport gains from software and digital services, especially in fast-changing industries. That gap can make you miss durable improvements when intangibles rise faster than measured inputs.
Where undercounts hide
Software, data platforms, and other intangibles often lack clear price or investment tags in accounts. As a result, output tied to these assets can be recorded slowly or not at all.
Economic research notes that IT‑intensive services are most exposed. When firms use cloud tools and embedded code, measured labour gains may lag real gains in per-hour output.
How revisions change the view
Recent BEA updates raised output and shifted BLS-based series, showing that revisions can move your view of the long-run trend. Changes in consumption and real compensation inputs also alter model signals.
“If intangibles are missed, models may understate trend growth even if timing of shifts is still visible.”
- Which industries: software, digital platforms, and IT-enabled services.
- Key effect: total factor productivity can be misread when intangibles are absent.
- Practical step: track internal metrics for software-enabled gains alongside official data.
Bottom line: treat upside from intangibles as a plausible tailwind, not a guarantee. Use a revision-aware checklist and link internal information to national releases when you plan investments.
AI, Remote Work, and New Technologies: What Will Actually Move the Needle?
Technology can help, but real gains come when you match tools to clear workflows and capital investments.
Generative AI: promise vs near-term effects
Generative AI reduces time on routine tasks and speeds drafting. Research suggests its broad, durable lift to labor output will be small at first—think incremental gains, not regime shifts. Acemoglu-style estimates point to about a 0.1 percentage point annual bump in growth under optimistic adoption.
Work-from-home: mixed evidence across industries
FRBSF finds sectors with more remote roles did not see outsized gains after 2020. Outcomes vary by industry, task frequency, and management practice.
Capital deepening and automation: practical pathways
Focus on proven levers: capital deepening, RPA, and workflow redesign. Start narrow, measure deltas, and scale where results persist.
- Tip: prioritize high-frequency tasks with clear SOPs.
- Tip: invest in training and data governance to turn tools into measurable growth.
- Tip: align capital spending with processes that enable continuous improvement.
“Tools matter, but adoption and process change determine whether you see real gains.”
Top New Productivity Tools and Techniques You Can Use in 2026
Focus on tool mixes that pair automation with clear process redesign for fast wins. Start small, measure effects, and scale what moves the needle for your teams.
AI copilots for research, summarization, and code
AI copilots cut time on drafting, summaries, and routine coding. Standardize prompts and playbooks so every worker gets consistent output and compliance.
Workflow orchestration and no-/low-code automation
Orchestrate repeatable flows to reclaim hours and lower errors. Map processes first, then automate—avoid codifying broken steps.
Knowledge systems and retrieval
Centralize documents with retrieval-augmented search so teams stop hunting information. Faster access drives better, faster decisions across industries.
Meeting and time compression
Compress meetings with async updates, shared docs, clear SOPs, and protected focus blocks. Train workers with short, task-based modules to speed adoption.
“Stage deployments to deliver quick wins this year while building foundations for compounding gains in 2026.”
- Build data pipelines to track cycle time, rework, and throughput.
- Apply techniques by function—claims triage, backlog grooming, or FP&A scenarioing.
- Stage rollouts to capture proof points before broad rollout.
Measuring Your Gains: Metrics, Benchmarks, and Data Discipline
Before you change workflows, agree on how you will measure gains and what counts as durable improvement. Pick one external anchor and make internal series comparable to it.
From vanity to value: output per hour and TFP proxies
Make output per hour worked your north-star. Back it with cohort baselines so you spot real growth and not short swings.
When full factor accounting is impractical, use simple TFP proxies: throughput per labor unit and output per capital dollar. These proxies help translate operational gains into gdp-consistent measures.
Instrumenting workflows: time-series, cohorts, and revision-aware KPIs
Track clear time-series across teams. Align definitions so each series stays comparable after process changes.
Adopt revision-aware KPIs that note BEA and Bureau of Labor Statistics updates. Add confidence bands to rate changes and benchmark growth rates against peers and the market each year.
“Anchor internal metrics to external series and institutionalize reviews to separate durable trend improvements from one-off spikes.”
- Do this: standardize time capture and task tags to reduce attribution errors.
- Do this: run quarterly cohort checks and keep incentives tied to sustained gains.
- Do this: quantify changes with confidence intervals before you scale investments.
Conclusion
Recent readings suggest modest upside, but the case for a lasting higher trend remains below even odds. Models place the chance of a sustained high-growth regime near 40–41%, so plan with guarded optimism.
Focus on what you control: allocate capital carefully, redesign core processes, and train your workers. Treat pandemic-era spikes as a short period example of cyclical shifts, not a blueprint for every period.
Measure against labour productivity and output, stage investments, and communicate in market-ready terms. Implement the tools, instrument workflows, and revisit the plan as new data and economic research confirm durable change.