Electricity has become a strategic input for anyone deploying artificial intelligence at scale. Where a company once compared cloud regions on price and latency, it now asks whether the grid in that region can deliver the megawatts on the schedule the project needs.
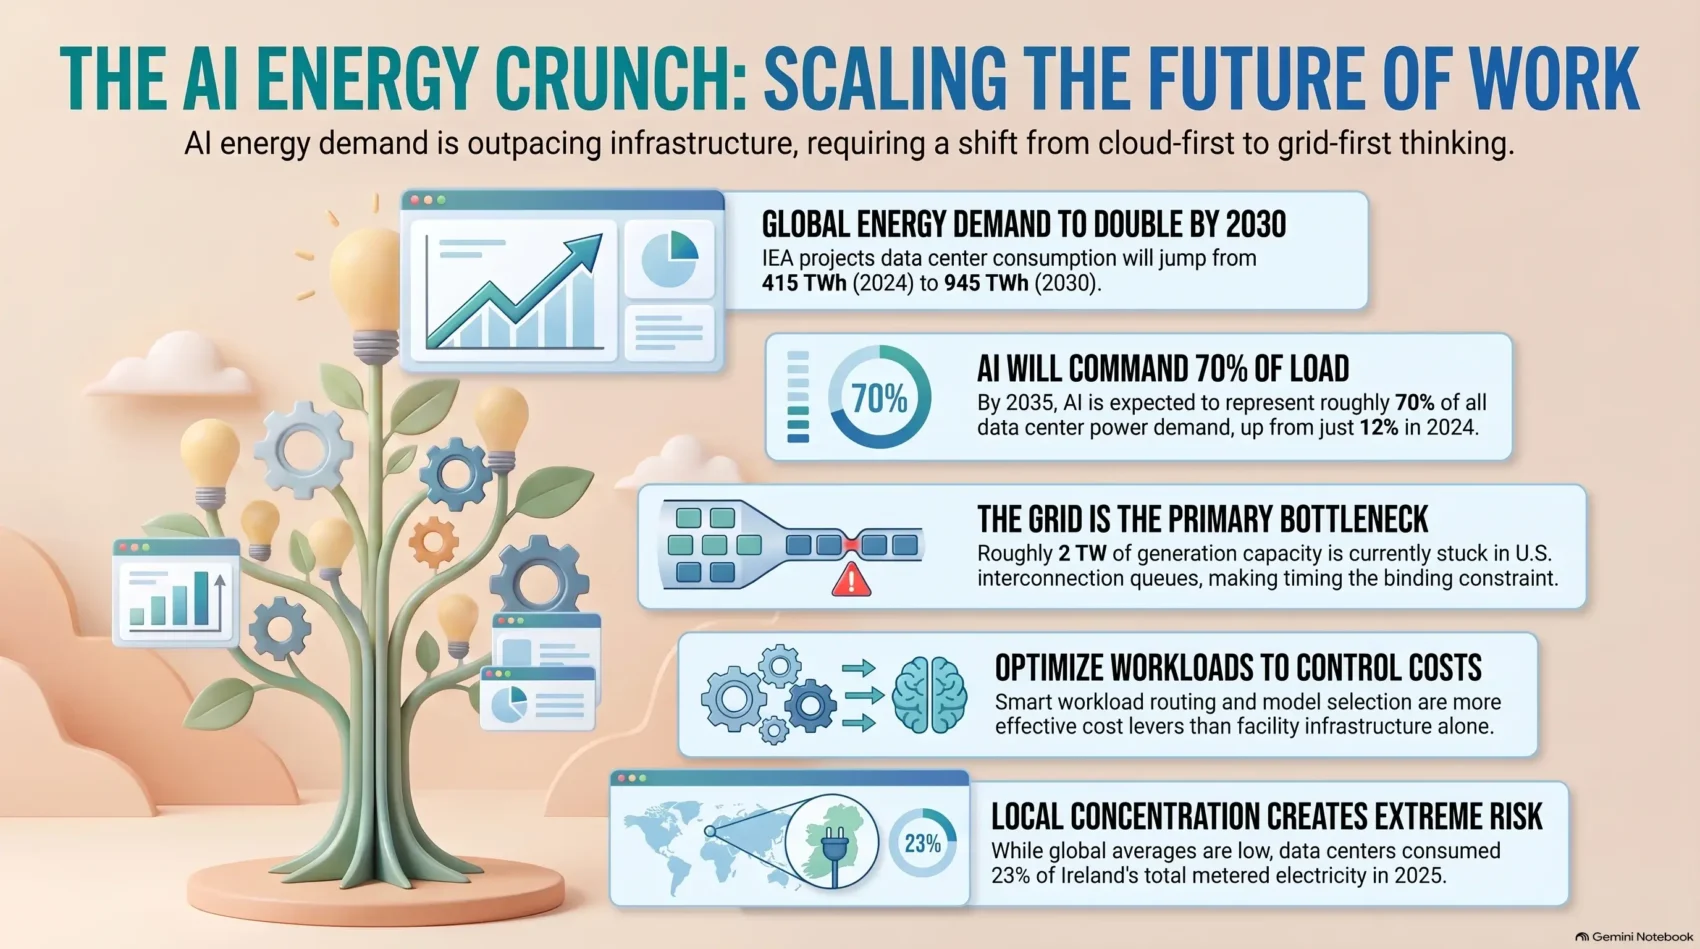
The macro numbers explain why. The International Energy Agency puts global data centre electricity consumption at 415 TWh in 2024, roughly 1.5% of the world’s electricity, and projects about 945 TWh by 2030 in its base case. That is a doubling inside six years, driven mostly by AI workloads.
Your own exposure, though, is set locally rather than globally. Regional tariffs, interconnection queues, grid headroom and permitting timelines decide what AI capacity actually costs you.
This guide covers what the current IEA, Berkeley Lab, Deloitte and CSO Ireland data show, where the constraints bite, and how to plan capacity without betting the budget on a single forecast.
Key Takeaways
- Global data centre electricity was 415 TWh in 2024, about 1.5% of world consumption, and the IEA projects roughly 945 TWh by 2030.
- US data centers used 4.4% of national electricity in 2023 and could reach 6.7% to 12% by 2028, according to Berkeley Lab.
- Deloitte expects data center demand to hit 176 GW by 2035, with AI rising from 12% of that load to about 70%.
- Roughly 2 TW of generation sits in US interconnection queues, which is why timing, not technology, is the binding constraint.
- Local concentration matters more than global averages: data centres took 23% of Ireland’s metered electricity in 2025.
Understanding AI Data Center Energy
Before you can budget for it, agree what you are measuring. Data center electricity covers training, inference, storage, networking, cooling and facility overhead, and different studies draw the boundary in different places.
Inference is now the larger share of most production estimates, because a model is trained once and queried continuously. Training figures remain the harder number to pin down, since few providers publish them.
Per-query estimates give a useful sense of scale. Google reported in August 2025 that the median Gemini text prompt uses about 0.24 Wh of electricity and 0.26 ml of water. OpenAI’s Sam Altman has put an average ChatGPT query near 0.34 Wh, and Epoch AI has estimated roughly 0.3 Wh. These are the same order of magnitude, which is reassuring, but they cover typical short prompts rather than long documents or agentic chains.
Units matter here. Watt-hours describe a query, megawatt-hours a monthly bill, gigawatts capacity and terawatt-hours national consumption. Confusing power with energy is the most common error in board papers on this subject.
The Expanding Role of Data Centers in an AI World
Data centers already underpin ordinary business life: payments, streaming, mapping, messaging and every SaaS tool your team opens before lunch. AI has not replaced that load, it has been layered on top.
Deloitte estimated AI at about 12% of the roughly 33 GW of US data center demand in 2024, with conventional workloads carrying the rest. By 2035 it expects AI to represent around 70% of a much larger total.
Geography is shifting too. Latency-sensitive inference pushes capacity closer to users, which is why operators are building in secondary markets rather than only established hubs. The same logic drives edge computing investment.
Electricity Consumption Trends in U.S. Data Centers
The most authoritative US figure comes from Lawrence Berkeley National Laboratory, whose December 2024 report for the Department of Energy found data centers consumed about 4.4% of US electricity in 2023 and projected a range of 6.7% to 12% by 2028.
Treat that range as the honest answer. The spread reflects real uncertainty about chip efficiency, utilisation and how quickly announced capacity gets built.
National averages also hide the concentration that creates real risk. Ireland is the clearest example: the Central Statistics Office reported that data centres consumed 23% of the country’s metered electricity in 2025, at 7,663 GWh, up 10% year over year while all other users grew 2%. Data centres there now use nearly as much metered electricity as every household combined.

Business Costs and Operational Efficiency in the AI Era
For most companies the cost impact arrives indirectly, through cloud pricing, colocation rates and commercial tariffs rather than a meter you own.
Efficiency has stopped improving at the pace it once did. The Uptime Institute’s 2025 global survey found average power usage effectiveness stuck near 1.54, roughly where it has sat for years. Facility overhead is no longer falling fast enough to offset rising compute density.
That makes workload efficiency your main lever. Model choice, batching, caching, quantisation and routing simple requests to smaller models change the bill far more than any single infrastructure decision, which is why AI cost control now belongs inside your LLM operations strategy rather than in a separate sustainability workstream.
The rest is contract structure: electricity terms, cooling, backup generation and demand charges all feed operating expenditure. Measuring cost per useful output over time tells you more than any published per-query average, and it plugs directly into ordinary cloud cost optimization practice.
Environmental and Community Impact of Rising Energy Demand
Emissions depend on the grid you plug into, not the workload. The same cluster produces very different carbon output on a coal-heavy system than on one dominated by nuclear, hydro or wind.
Local effects have become the sharper political issue. New capacity can affect residential rates, land use and water availability, and communities increasingly expect concrete benefits in exchange. That pressure is why several US states have opened rate cases specifically for large loads.
New infrastructure typically raises three local questions:
- Who pays for the grid upgrades a new load requires.
- How land and water use change around the site.
- What jobs and tax revenue the facility actually delivers.
Efficiency alone does not decarbonise anything if incremental demand is met with new fossil generation. If your company reports under a climate framework, that distinction matters for your carbon neutrality claims, and it is exactly the kind of scope 2 and scope 3 detail that carbon accounting software is built to trace.

Future Projections and Infrastructure Expansion
The IEA’s base case has global data centre consumption reaching about 945 TWh by 2030, close to 3% of world electricity, and roughly 1,200 TWh by 2035.
In the United States, Deloitte’s 2026 power and utilities outlook, published on 29 October 2025, expects data center demand to reach 176 GW by 2035, a fivefold increase on 2024. Its earlier June 2025 study framed the same trend from the AI side: AI-specific data center power growing more than thirtyfold, from 4 GW in 2024 to 123 GW in 2035.
Each of those figures is a scenario, not a schedule. Adoption rates, chip efficiency, workload mix and the gap between announced and completed projects all move the result. Scale gives a useful mental anchor: the IEA notes that a typical AI-focused data centre consumes about as much electricity as 100,000 households, while the largest now under construction will use twenty times that.
Plan against a range rather than a point estimate, and revisit it annually. Treating a single 2035 number as a commitment is how capital plans go wrong.
Innovative Technologies Shaping Data Center Efficiency
Cooling is the largest non-compute load in most facilities, and rising rack densities have made air cooling impractical for the newest accelerators. Direct-to-chip liquid cooling and immersion designs are moving from pilot to default in AI halls.
Water is the trade-off. Some liquid designs cut electricity but increase water draw, a poor bargain in a stressed catchment. Closed-loop systems and dry coolers avoid that, usually at higher capital cost.
On the silicon side, gains come from better performance per watt, higher-bandwidth memory, more efficient interconnects and improved power delivery. Vendor claims vary widely, so treat them as directional until you measure the effect on your own workloads.
The practical takeaway is that equipment choice ties lifecycle cost, water availability and reliability to how fast you can actually deploy AI capacity. That decision belongs in digital procurement, not only in engineering.
Challenges in Meeting Rapid Energy Demand
Data centers run flat, 24 hours a day, which puts far more stress on local infrastructure than the same annual consumption spread across dispersed users.
Deloitte’s April 2025 survey of 120 data center and power company executives found 72% rated power and grid capacity constraints as very or extremely challenging, and 79% expected AI to increase power demand through 2035.
The queue is the real bottleneck. Deloitte’s 2026 outlook notes roughly 2 TW of capacity waiting in US interconnection queues, close to twice the currently installed fleet, while peak demand is set to grow about 26% by 2035. Meanwhile fewer than 5% of facilities take part in demand-response programmes, even though pilots show 10% to 30% of load can be flexed during peak events without disruption.
Growth regions have reported the predictable symptoms:
- Load-relief warnings during peak periods.
- Power quality issues around large converter loads.
- Substation and transmission upgrades running behind schedule.
- Rate cases opened specifically for large customers.
Assess transmission access and substation readiness before you buy land or sign a long-term contract. Site selection is a grid decision first and a real estate decision second.
Supply Chain and Regulatory Roadblocks
Equipment availability now shapes timelines as much as capital does. In the same Deloitte survey, 65% of respondents flagged supply chain disruption as a concern for data center buildouts.
Lead times tell the story. Transformers and switchgear are quoted in years rather than months, and Deloitte notes that new gas-fired generation now costs more than two and a half times what comparable projects cost a few years ago. The US electric power sector will need over $1.4 trillion in capital investment through 2030 to keep up.
Permitting adds its own delay. Environmental review, local zoning and grid studies routinely run longer than the construction schedule they precede, and several jurisdictions have tightened requirements for large loads specifically.
Mitigations are unglamorous: order long-lead equipment early, qualify alternate suppliers, build permitting milestones into the project calendar, and write contingencies for slippage. Engaging regulators early saves more time than any procurement trick, and utilities belong in your partner ecosystem strategy rather than on a vendor list.
Optimizing Infrastructure and Power Distribution
Grid-enhancing technologies unlock existing capacity faster than new lines can be built. Dynamic line ratings, power flow control and reconductoring raise throughput on existing corridors in months rather than the years a new transmission project takes.
On site, batteries, local generation and intelligent controls reduce peak exposure. The economics improve when you can also shift load, since training jobs and batch inference are far more schedulable than interactive traffic.
Workload mobility is the underused lever. Moving flexible compute to where and when electricity is cheap and clean is a software problem, and it fits naturally into AI agent workflows and orchestration layers you may already run.
Coordinate scheduling, storage procurement and utility programmes together. Treated separately they compete for the same budget; together they compound.

Regional Analysis of Data Center Grids
US capacity is heavily clustered, concentrating transmission, generation and affordability risk in a handful of markets.
Northern Virginia remains the clearest case. The Energy Information Administration notes that PJM’s Dominion zone serves the world’s largest concentration of data centers, and Virginia’s commercial electricity sales grew by nearly 30 million MWh between 2019 and 2025. Dominion Energy’s 2025 integrated resource plan reported contracts for 47.2 GW of additional data center demand, having raised its forecast by 17% in under a year.
Newer markets are attracting development as established hubs fill up. That redistribution is reshaping regional planning much as earlier waves of urban technology investment did.
A regional screening framework should cover:
- Transmission access and substation headroom
- Generation mix and carbon intensity
- Water availability and permitting
- Labour market depth for construction and operations
- Residential rate exposure and political climate
- Interconnection queue position and realistic energisation date
Insights from Leading Research and Industry Surveys
Triangulating sources matters here, because vendor material, think-tank estimates and official statistics often disagree by a wide margin.
What the IEA and Berkeley Lab Data Show
The IEA’s Energy and AI analysis provides the global baseline of 415 TWh in 2024 and the 945 TWh projection for 2030. Berkeley Lab’s report for the Department of Energy supplies the US picture: 4.4% of national electricity in 2023, rising to between 6.7% and 12% by 2028. Both are transparent about method, which makes them better anchors than headline forecasts.
Key Takeaways from Deloitte Insights
Deloitte’s survey work adds the practitioner view. Beyond the grid and supply chain findings, 90% of data center companies rated increasing technological innovation as very or extremely important, and 81% prioritised making infrastructure more intelligent. Notably, 78% of data center respondents and 67% of utility respondents called cooperation between the two sides effective, but only 15% and 8% respectively called it highly effective.
That gap between “effective” and “highly effective” is where most project delays live. It is also a reminder to check who was surveyed and when before quoting any figure, a discipline worth extending to your wider augmented analytics reporting.
Strategic Planning for an AI-Powered Future
Turn the forecasts into decisions with a few concrete steps:
- Build demand scenarios using published ranges rather than a single number, and avoid assuming linear growth.
- Start utility conversations early, because interconnection studies routinely outlast a one or two year construction plan.
- Prioritise efficiency investment where it compounds: workload routing, model selection, utilisation and cooling design.
- Explore flexible-load programmes such as controllable load arrangements, which can shorten time to connection in constrained regions.
- Protect the downside with clean energy procurement, backup capacity, water planning and community engagement milestones.
Assign ownership explicitly. Energy strategy spans facilities, finance, engineering and sustainability, which is why it keeps appearing in the remit of emerging C-suite roles, and it belongs in your risk management framework like any other single point of failure.
Emerging Strategies for Sustainable Growth
The most durable answers are collaborative, because no operator controls the grid it depends on. Joint forecasting is the obvious starting point: when operators and utilities plan against a shared load curve, both sides can size investment properly instead of hedging against each other’s optimism.
Other approaches that are gaining traction:
- Transparent cost allocation, so existing ratepayers are not silently subsidising new large loads.
- Clean energy tariffs that fund new generation rather than reallocating existing supply.
- Demand-response commitments with real, contracted flexibility.
- Shared infrastructure studies across multiple developers in one corridor.
- Community benefit agreements tied to measurable local outcomes.
Companies buying AI capacity rather than building it still benefit from asking providers these questions, because the answers reveal how exposed a supplier is to the next tariff increase or connection delay. Increasingly this is a business model innovation question as much as a facilities one, and it sits alongside broader green technology trends.
Conclusion
A single AI query uses a trivial amount of electricity. Millions of them, running continuously across increasingly dense hardware, add up to a genuine infrastructure problem, and that is the gap most business plans miss.
Your real risks are local. Grid concentration, interconnection delay, rate increases, emissions accounting, water constraints and equipment lead times will decide your costs long before any global average does, and the same variables shape wider cloud computing trends.
Efficiency helps on both sides of the ledger. Liquid cooling, better silicon, storage, flexible scheduling and smarter workload routing cut cost and infrastructure pressure at once. Pair that with honest demand modelling, early utility engagement and credible clean energy procurement, and expansion becomes a plan rather than a gamble.
Found this useful?
Make SmartKeys a preferred source on Google, and our articles will surface more often in your Top Stories, AI Overviews, and AI Mode.
Add as Preferred Source