Visual thinking means working out a problem with pictures instead of sentences. A sketch, a board of sticky notes, a map of boxes and arrows: each lets you see a situation rather than read about it. For task management that solves something a plain list cannot. A list tells you what is on your plate. A picture shows how the pieces connect and where the work has stopped moving.
This guide covers what visual thinking genuinely does for your workload, which popular claims about it are folklore, four methods you can try this week, and what the main tools cost in 2026.
Key Takeaways
- Pairing a picture with words gives memory two routes back to the same idea. That is the mechanism behind most of the benefit.
- Two widespread claims are not supported by evidence: that people split into visual and verbal learners, and that the brain reads images 60,000 times faster than text.
- Mind maps, storyboards, visual notes and Kanban boards each solve a different problem, so pick by task rather than by fashion.
- A visual system only helps while someone keeps it current. An abandoned board is worse than no board.
Understanding Visual Thinking
Visual thinking uses images, symbols and spatial arrangement to work through information. You are not decorating notes. You are using position, size and distance to carry meaning a sentence would have to spell out.
Defining Visual Thinking
Put two related tasks next to each other on a board and the relationship is visible without a word of explanation. Draw an arrow between them and you have added a dependency. The layout does part of the thinking for you.
In practice this shows up as mind maps, sketches, flowcharts and boards. A project manager drawing swimlanes on a whiteboard is doing visual thinking, and so is a freelancer who colours next week’s calendar by client.
What the Evidence Actually Supports
Two findings from cognitive psychology hold up well and explain most of the benefit.
The first is the picture superiority effect. In recall experiments people remember pictures better than the words for the same things. It is a robust result, repeated many times.
The second is dual coding theory, developed by the psychologist Allan Paivio. It proposes that we store verbal and visual information in two separate but linked systems. An idea encoded both ways has two routes back instead of one. This is why a labelled diagram usually beats either the label or the drawing alone.
Both point the same way for your work: combine the picture and the words. A board of unlabelled boxes is not a memory aid, and neither is a wall of text.
Two Claims You Should Ignore
The first is that people divide into visual and verbal learners, and that matching material to a person’s type improves results. Tested directly, the matching benefit does not appear. Preferences are real; a matching effect is not. Treat “I am a visual person” as a statement about what someone enjoys, not about what will work.
The second is that the brain processes images 60,000 times faster than text. No study is ever cited for it because none exists. It circulates through marketing slides. Vision is fast, and that is worth saying plainly, but the number is invented.
The Importance of Visual Thinking in Task Management
Task management is mostly a problem of holding too much in your head: what is due, what is blocked, who is waiting on you. Visual methods move that load onto a surface you can look at.
Why Visuals Help With Complex Work
Written lists are excellent at sequence and poor at structure. If eight tasks belong to three projects and two cannot start until a client replies, a list hides that. A board with three columns and a waiting lane shows it at a glance.
The gain is largest when work has shape: dependencies, parallel tracks, handovers. For a flat set of errands a simple to-do list is faster and quite enough.
Seeing Where Work Is Stuck
The most useful thing a visual system does is make stalled work obvious. A card sitting in “in progress” for nine days is visible to everyone. In a task list, that same card just scrolls past.
This is why Kanban boards spread from factory floors into offices. Toyota used physical cards to signal when a station needed parts, and the office version keeps that logic: limit how many cards sit in progress, and bottlenecks announce themselves. Colour-coding by client does something similar for a solo workload.
Visual Thinking vs. Verbal Thinking
These are two modes of working, not two types of person. Most people use both, and the useful question is which suits the task in front of you.
What Each Mode Is Good At
Visual thinking is strong when you need to see relationships: how parts fit, what depends on what, where a process branches. It suits early, messy stages when the shape of the problem is still unclear.
Verbal thinking is strong when precision matters. Definitions, conditions and exceptions all need language. A diagram cannot express “unless the invoice was raised before the 15th” without turning into a paragraph anyway.
Use Both, in Order
Sketch first, write second. Map the problem visually to find its structure, then write the commitments in words. A launch plan drawn as a timeline shows the sequence; the brief underneath says who owns what and by when. A handsome diagram with no written commitments produces confident agreement about nothing in particular.
Visual Thinking Strategies for Effective Task Management
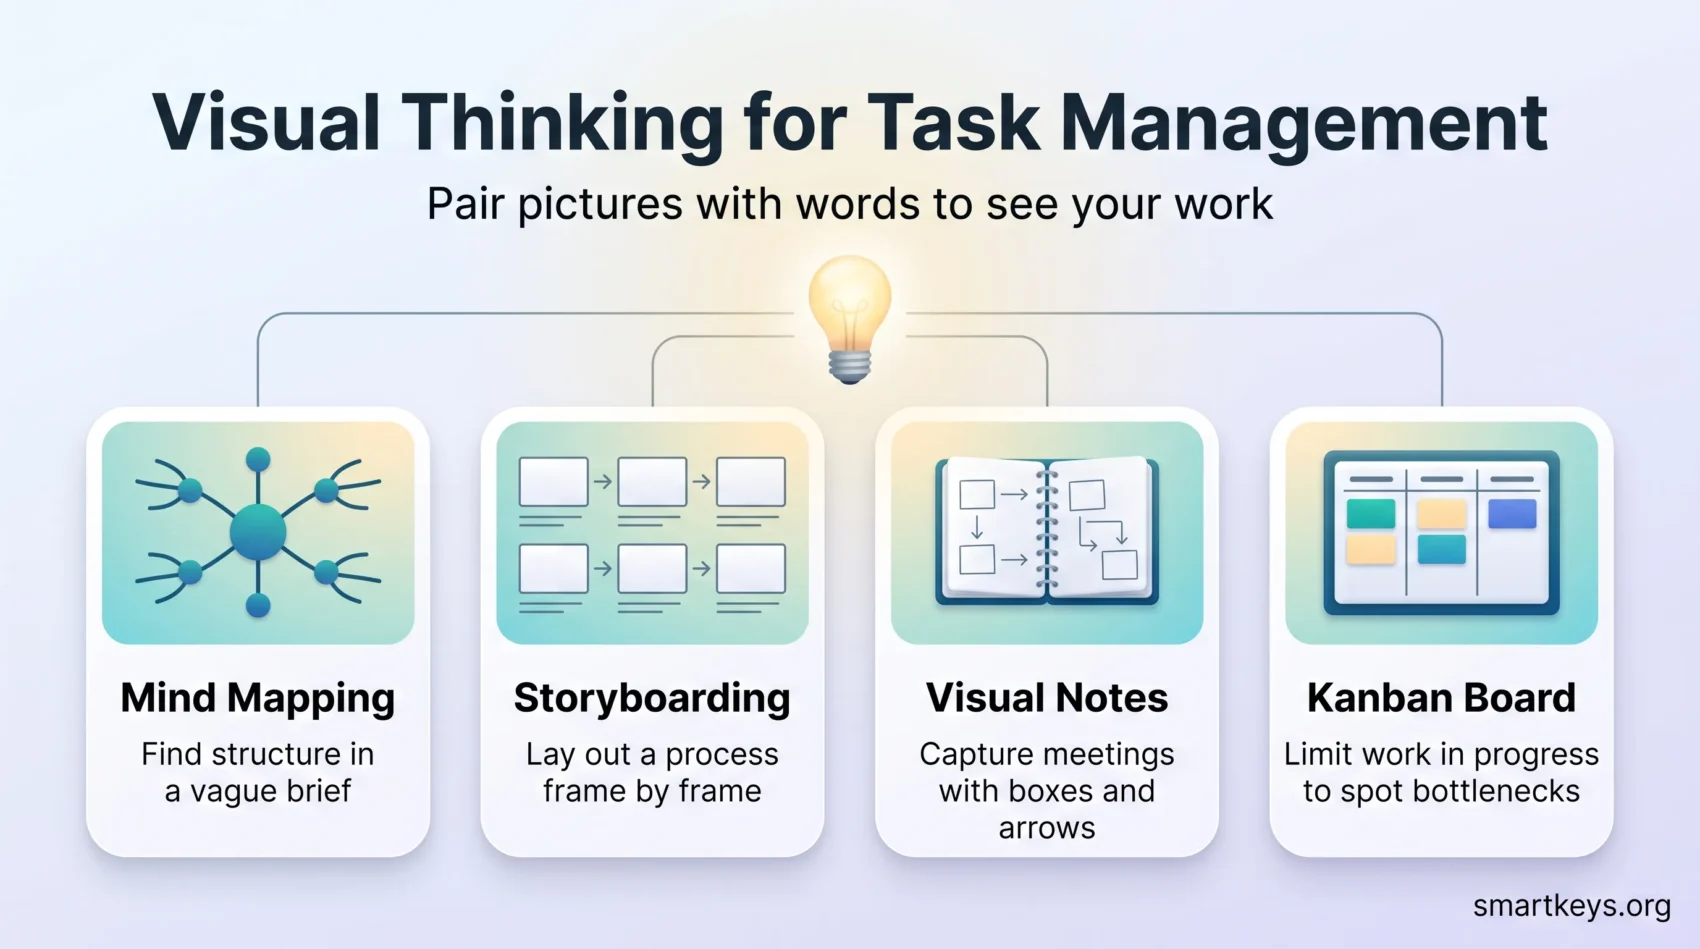
Four methods cover most situations. They are not interchangeable.
Mind Mapping
A mind map starts with one central topic and branches outward. It suits the moment when you have a broad subject and no structure yet: unpacking a vague brief, or preparing for a difficult conversation.
Its strength is that you can add a branch anywhere without rewriting what came before. Its weakness is sequence, because mind maps are poor at showing what happens first. See our guide to mind mapping for problem solving.
Storyboarding
Storyboarding lays out a process as a row of frames, one per step. Borrowed from film, it works for anything with a beginning and an end: an onboarding flow, a product demo, a customer journey.
The value is that gaps become visible. If frame three assumes the customer already has an account and frame two never created one, you see the hole. Six rough boxes on paper find more problems than six pages of specification.
Visual Note-Taking
Visual note-taking mixes short written points with boxes, arrows and small drawings while you listen. It suits meetings where information arrives faster than you can write. Two cautions: it takes practice, and the notes are for you rather than the record. If a decision needs sharing, transcribe it into a digital note a colleague could read cold.
Kanban Boards
A Kanban board is columns for stages and a card per task, moving left to right as work progresses. It is the most practical of the four day to day because it needs no artistic skill.
The rule that makes it work is a limit on how many cards may sit in one column. Without it you have a prettier to-do list. With it, you must finish things before starting new ones, which is the point. Our guide to Trello power-ups covers automating that.
Benefits of Visual Thinking Productivity
The gains are real, and more modest and specific than the numbers quoted elsewhere.
Less Held in Your Head
The clearest benefit is offloading. Once your commitments are visible on a board, you stop spending attention tracking them. That frees capacity for the work itself, the same logic behind a brain dump or a second brain.
Faster Shared Understanding
In a team, a diagram gives everyone the same reference. Instead of five people holding slightly different mental models of the project, there is one picture anyone can point at. Disagreement surfaces faster too: a colleague can put a finger on the box they doubt, where in prose the same objection stays vague. This is one reason silent meetings often open with a shared board rather than a presentation.
Where the Benefit Stops
Visual thinking does not make decisions for you, and it does not survive neglect. A board nobody updates becomes misleading within a fortnight, because people still trust it after it stopped being true. Maintaining one costs time, and for a small, predictable workload that time is not repaid.
Tools to Enhance Visual Thinking
Prices below come from the vendors’ own pricing pages and are current as of September 2026. Start on a free tier and pay only once a specific limit becomes annoying.
Mind Mapping Software
Xmind offers a free plan with up to 10 online maps. Pro is listed at $4.92 per month and Premium at $8.25 per month, with Premium adding Gantt charts, task management and a larger monthly AI credit allowance. MindMeister’s free tier is tighter at three mind maps, with unlimited collaborators. Either free tier is usually enough to decide whether the method suits you before spending anything.
Shared Whiteboards
Miro is the common choice for team boards. The free plan allows three editable boards. Starter is $8 per member per month billed annually and lifts that limit; Business is $20 per member per month annually and adds workspaces and more AI credits.
If you are choosing between platforms, we compare them in Miro vs Lucidspark, and our overview of digital whiteboards for team collaboration covers running a session on one.
Data Visualization Platforms
Tableau and Microsoft Power BI turn datasets into charts and dashboards. Power BI Pro is listed at $14 per user per month paid yearly, and Premium Per User at $24.
These are a different category from sketching tools. They show numbers you already have; they do not help you think through a problem you do not yet understand. If the aim is to persuade rather than explore, data storytelling is the relevant skill.
Cognitive Productivity Techniques Through Visualization
Beyond managing tasks, visual methods help with problems that resist a straight answer.
Breaking Down Complex Ideas
When a problem feels overwhelming, it is usually because too many parts compete for attention at once. Drawing them out fixes each part in place so you can examine one without losing the others.
The practical move is to give every element a box and every relationship a line. A messy first draft is expected. The value lies in noticing what you could not name until you tried to draw it. This pairs naturally with prioritization, because once the parts are visible their relative weight is easier to judge.
Using Flowcharts for Problem Solving
A flowchart maps a process as steps and decision points. Each diamond is a question with branching answers, so you can trace every path a case might take.
They are most useful for anything with exceptions: a refund policy, an escalation path, an approval chain. Drawing the chart usually reveals a route nobody had considered, which is exactly the case that causes trouble later. For choosing between competing options rather than mapping a process, a prioritization framework fits better.
Creative Problem-Solving Strategies with Visual Thinking
Visual methods change how a group works on a problem, mostly by making disagreement easier to express.
Using Visual Aids to Sharpen Critical Thinking
When an argument is drawn out, its weak points become locatable. A colleague can point at a specific arrow and say the connection does not hold. In discussion alone, the same objection comes out as unfocused unease and gets dropped. The tool matters less than the fact that the reasoning now sits on a surface everyone can mark up.
Employing Visuals for Brainstorming Sessions
Writing every idea on its own note and posting it to a shared surface has two effects. Quieter people contribute in parallel rather than waiting for a gap in the conversation, and ideas can then be grouped by theme.
The grouping step is the one teams skip. Fifty notes on a wall is raw material, not a result. Clustering them and naming each cluster turns the session into something you can act on.

Design Thinking and Its Connection to Visual Thinking
Design thinking is a structured way of solving problems for users, and it leans on visual methods at almost every stage.
Understanding Design Thinking Principles
The method runs in roughly five stages: understand the people affected, define the real problem, generate options, build a rough version, then test and revise. Its central claim is that the problem you were handed is often not the one worth solving, and you discover this by putting something crude in front of a real user early. Our introduction to design thinking covers the full process.
How Visual Thinking Supports Design Methods
Every stage produces something you can look at. Research becomes a journey map. Ideation becomes a wall of sketches. The prototype is itself a visual object, even when it is paper.
A drawing also invites criticism in a way a document does not. Nobody feels rude redlining a rough sketch, so feedback arrives while it is still cheap to act on.
Implementing Visual Learning Techniques
The goal is a small set of visual habits you actually keep, not an elaborate system you abandon in three weeks.
Strategies for Visual Learning in Task Management
Four that repay the effort:
- Mind mapping at the start of anything ill-defined, to find the structure before you commit to a plan.
- Diagrams and flowcharts for processes with branches, so exceptions are visible rather than remembered.
- Colour-coding with a small, fixed scheme. Four categories work; twelve become noise.
- Reusable layouts so you are not designing from scratch each time.
Creating Visual Systems That Survive
A system lasts when updating it is easier than ignoring it. Three things make that likely:
- One home. Pick a single board or file. Two competing boards guarantee neither is trusted.
- A standing review. Ten minutes at the same point each week to move cards and delete what is done. Our guide to weekly planning covers building that slot.
- Deliberate limits. Cap the columns, the colours and the cards in progress. These systems fail from accumulation, not from missing features.

Kept small, this framework does the job. The aim is not to visualise everything, only the few things that keep going wrong while they stay invisible.
The Role of Visual Thinking in Leadership and Team Dynamics
For anyone leading work the visual question is simple: could the team draw the plan from memory? If not, they cannot act on it independently.
Communicating a Plan People Can Picture
A strategy that fits on one diagram gets repeated. One that takes eleven slides gets summarised inaccurately. Fitting a plan onto a single surface forces you to decide what is essential and to name the trade-offs. Our guide to remote leadership skills covers this when the team is distributed.
Enhancing Team Collaboration with Visual Tools
A shared board also changes who speaks. In live discussion the confident and the senior dominate by default. On a board everyone writes at once, and ideas get read before anyone knows who wrote them.
For teams across time zones that shift matters more, because a board holds the discussion while people are offline. Our guide to asynchronous work covers the wider practice, and task management fundamentals covers the ground rules any shared board needs.
Conclusion
Visual thinking earns its place for one reason: it moves structure out of your head and onto a surface where it can be seen, questioned and shared. Dependencies become visible. Stalled work stops hiding. A team argues about one picture instead of five private versions of the plan.
The evidence behind it is narrower than the marketing suggests, and that is fine. Pictures paired with words are remembered better than either alone, which is enough.
Start with one board, one colour scheme of no more than four categories, and one weekly slot to keep it honest. If it survives a month, extend it. If not, you have lost an hour and learned something about how you actually work.
Found this useful?
Make SmartKeys a preferred source on Google, and our articles will surface more often in your Top Stories, AI Overviews, and AI Mode.
Add as Preferred Source