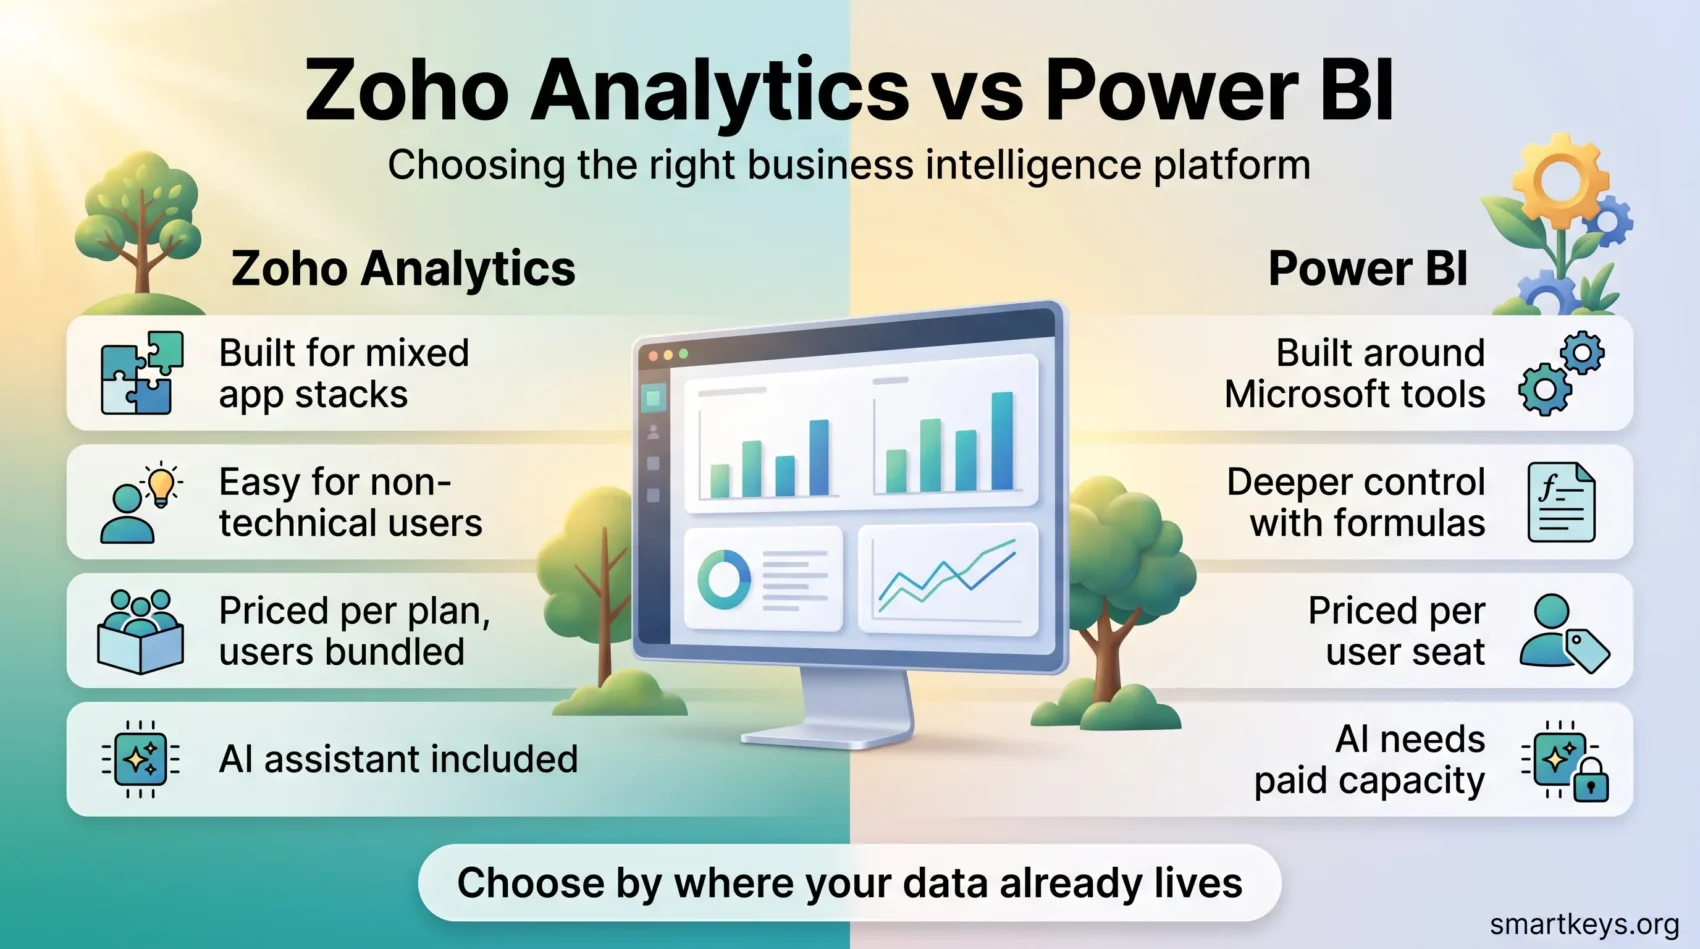
Zoho Analytics and Microsoft Power BI both do the same basic job: they take the numbers your company already produces and turn them into charts, dashboards and reports the whole team can read. That job is called business intelligence, or BI. In practice it means a sales lead stops rebuilding the same spreadsheet every Monday, because the figures update themselves.
The two platforms go about it very differently. Power BI is woven into Microsoft’s world of Excel, Azure and Teams, and it rewards teams that already live there. Zoho Analytics is built to sit on top of a mixed stack of business apps and to stay usable for people who do not write code. This comparison covers what each one costs in 2026, how they connect to your data, what their AI features require, and which kind of team each one actually suits.
Key Takeaways
- Power BI Pro costs $14 per user per month and Premium Per User $24, both billed annually. Power BI Desktop is free.
- Zoho Analytics is priced per plan rather than per seat: $30 a month for the two-user Basic plan, rising to $575 for Enterprise, with 20% off on annual billing.
- Copilot, the AI assistant in Power BI, needs a paid Fabric capacity (F2 or higher) or a Power BI Premium capacity. A Pro or Premium Per User licence on its own is not enough.
- Zoho advertises more than 500 data sources and includes its Zia AI features in the regular plans.
- Both run in the cloud; both also offer a self-hosted route, though the details and the price differ.
What Business Intelligence Tools Actually Do
Most companies already have the data they need. It just sits in different places: orders in the shop system, tickets in the helpdesk, spend in the accounting tool. A business intelligence platform pulls those sources into one place, cleans them up, and lets you build a chart or a dashboard on top.
The payoff is concrete rather than abstract. A support manager sees ticket volume by product without exporting a CSV. A finance team spots that one region’s margin dropped three weeks ago instead of at quarter end. Where the volume of raw material is very large, teams often stage it in a data lake first and point the BI tool at that.

Choosing between platforms is mostly a question of fit, not of features. Both tools can draw a bar chart. What separates them is where your data already lives, who will build the reports, and how the bill grows as more people want access.
What is Zoho Analytics?
Zoho Analytics is a self-service BI tool, which means the people who need the report are meant to be able to build it themselves rather than filing a request with IT. It is part of the wider Zoho suite, so it connects tightly to Zoho CRM, Zoho Desk and the rest of that family, but it is sold and used as a standalone product too.
Zoho states on its own site that the platform connects to more than 500 data sources, covering databases, cloud storage, files and business applications. Microsoft does not publish a comparable headline number for Power BI, so treat any direct connector count as a marketing figure rather than a measured one.
The platform also includes data preparation through Zoho DataPrep. Data preparation is the unglamorous step of fixing what arrives: removing duplicates, splitting a name field, making sure dates are dates. Getting that wrong is the most common reason a dashboard quietly shows the wrong number.
Features of Zoho Analytics
Three areas do most of the work in day-to-day use: preparing data, reaching it from anywhere, and keeping it locked down.
Data Preparation and Management
Zoho Analytics can clean, reshape and combine data before you chart it. Its automatic data blending joins tables from different sources without you writing the join by hand, which matters when your sales figures live in a CRM and your costs live in an accounting tool. You can still drop into custom SQL when the automatic route is not enough.
Mobility and Accessibility
Dashboards work in a browser and in Zoho’s mobile apps, so a manager can check a number from a phone between meetings. This is table stakes for both platforms rather than a differentiator, but it matters for teams that are rarely at a desk. If your team is distributed, the wider question of how work flows between tools usually matters more than the app itself.
Security and Governance
Zoho Analytics offers role-based permissions, two-factor authentication and IP-based restrictions on who can view a report. Governance is the boring half of analytics: it decides who sees salary data, who can change a shared dashboard, and what happens when someone leaves. If you handle staff or customer records, read it alongside the current rules on privacy at work.
What is Power BI?
Power BI is Microsoft’s business analytics platform. Most report building happens in Power BI Desktop, a free Windows application. Finished reports are published to the Power BI service, a browser-based hub where colleagues view and share them. That split matters in practice: Desktop runs on Windows only, so a designer on a Mac has to work around it.
Its real strength is proximity. If your figures already sit in Excel, SQL Server, Azure or Dynamics, Power BI reads them with very little setup, and the finished dashboard drops into Teams where people already talk. For a Microsoft-centric company that is a genuine advantage, and it is worth weighing next to the rest of your office suite decision.
Power BI also uses its own formula language, DAX, for anything beyond simple aggregation. You can build useful reports without it, but the deeper features expect someone on the team to learn it.
Power BI Features and Benefits
Power BI has become the default choice in many large organisations, and the reasons are worth separating from the marketing.
Custom Dashboards and Reporting
Dashboards are assembled by dragging visuals onto a canvas. The built-in library covers the usual charts, maps and tables, and Microsoft’s marketplace adds more. Reports refresh on a schedule: eight times a day on Pro, up to 48 on Premium Per User.
Data Governance Tools
Power BI carries the governance apparatus a large company expects. Sensitivity labels mark a report as confidential and carry that label into exports. Row-level security lets one dashboard show a regional manager only their own region. Audit logs record who opened what. These are the features that usually decide an enterprise rollout, and they sit alongside broader data governance practice.
Ease of Use for Beginners
Anyone comfortable with pivot tables in Excel will find the first hour of Power BI familiar. The friction arrives later, when a calculation needs DAX or a data model needs restructuring. Teams often underestimate that second stage and end up depending on one internal expert.

Zoho Analytics vs Power BI: Key Comparisons
The platforms overlap heavily on core charting. The differences show up in four places.
Data Connections
Power BI connects to Microsoft sources with almost no configuration, and its Power Query connector library covers a long list of databases, cloud services and third-party applications. Zoho leans the other way: it advertises broad coverage of business applications across vendors, which suits a company running a patchwork of SaaS tools rather than one ecosystem. If most of your numbers already live in a CRM and a handful of SaaS apps, that breadth is worth more than deep Azure integration.
Ease of Use and the Learning Curve
Both tools are approachable at the start. Zoho Analytics aims squarely at non-technical users and auto-generates suggested reports from a new data set. Power BI gives you more control and, in exchange, asks more of you once the questions get complicated. The honest test is who will build reports in six months: if it is a business analyst rather than a data specialist, the gentler curve is worth money.
AI Features and What They Cost
This is where the bills diverge. Zoho includes its Zia AI features, including the conversational Ask Zia, in its regular plans, with more capability on higher tiers.
Power BI’s Copilot works differently. Microsoft’s documentation is explicit: your organisation needs a paid Fabric capacity (F2 or higher) or a Power BI Premium capacity (P1 or higher). A Pro or Premium Per User licence alone is not sufficient. So the AI features are not a per-seat upgrade; they require capacity that is bought and billed separately. That is a real budget question for a small team, and it fits the wider pattern of AI being metered rather than bundled in SaaS.
Security and Governance
Both cover the essentials: encryption, permissions and access control. Power BI goes further for regulated enterprises through sensitivity labels, tenant-wide policies and audit logging tied to the rest of Microsoft 365. Zoho covers role-based access, two-factor authentication and IP restrictions, which is enough for most small and mid-sized companies. Match the depth to your actual obligations rather than to the longest feature list.
Pricing Structures of Zoho Analytics and Power BI
The two vendors price on different units, which is why headline comparisons mislead. Power BI charges per person. Zoho charges per plan, with a set number of users and data rows included.
Zoho Analytics Pricing
Zoho Analytics cloud plans, at monthly billing rates:
- Basic: $30 a month, 2 users, 0.5 million rows.
- Standard: $60 a month, 5 users, 1 million rows.
- Premium: $145 a month, 15 users, 5 million rows.
- Enterprise: $575 a month, 50 users, 50 million rows.
Paying annually takes 20% off. There is a free plan for 2 users and 10,000 rows across 5 workspaces, plus a 15-day trial of the paid tiers. Extra users and extra row capacity are sold as add-ons, and the row limit tends to bite before the user limit does for companies with high transaction volumes.
Power BI Pricing
Power BI’s published prices are straightforward:
- Power BI Desktop: free, for building reports on Windows.
- Power BI Pro: $14 per user per month, billed annually. Needed by anyone who publishes or views shared reports.
- Premium Per User: $24 per user per month, billed annually, adding larger models and more frequent refreshes.
- Fabric capacity: priced separately by capacity unit. Microsoft states that a one or three year reservation saves roughly 41% against pay-as-you-go rates.
The catch is that “free” applies only to building. Sharing a report with a colleague means both of you need a licence, so a ten-person team is buying ten seats.
What a Small Team Actually Pays
Take a team of ten who all need to view dashboards. On Power BI Pro that is $140 a month at list price. On Zoho Analytics the same ten people fit inside the Standard plan only if five of them are viewers you add on; realistically you land on Premium at $145 a month, which then covers fifteen users.
At ten seats the two are close. The gap opens in two directions. Add another twenty viewers and Zoho’s plan pricing wins clearly. Add a requirement for Copilot and Power BI’s bill jumps, because capacity is priced on top of the seats. Work out your own numbers before trusting either vendor’s comparison page, including Zoho’s.
Integrations and Extensibility
Beyond raw connector counts, the question is what happens after the connection. Both platforms support scheduled imports and ETL-style pipelines, the process of extracting data from a source, reshaping it and loading it into the analytics store.
Zoho’s advantage is breadth across vendors, which suits companies whose stack has grown by adding one tool at a time. It also connects cleanly to the rest of Zoho, so a company already on Zoho Desk or comparing Zoho One against Bitrix24 gets reporting across those tools without extra plumbing.
Power BI’s advantage is depth within Microsoft. Excel workbooks, SQL Server, Azure Synapse and Dynamics all behave as first-class sources. If your data warehouse already runs on Azure, that removes a whole layer of work, and it fits naturally with wider cloud platform decisions. Teams that build internal apps on low-code platforms or in AppSheet often find the same logic applies: staying inside one vendor’s ecosystem is cheaper in effort, more expensive in flexibility.
Collaborative Features
Analytics only pays off when the findings reach other people. Zoho Analytics lets you share reports with role-based permissions, publish dashboards to a wider audience, and embed them in other pages. Comments sit alongside reports so a discussion stays attached to the number it is about.
Power BI shares through workspaces and apps, and its strongest card is Teams. A report can be pinned into a channel where the conversation already happens, which removes the step of asking someone to log into another tool. For companies running on Microsoft 365, that single detail often decides the whole comparison.
Teams that track work in Airtable or Notion, or in Smartsheet, should check how their reporting layer will reach those tools too, because a dashboard nobody opens has no value.
Which Platform Should You Choose?
Neither tool is simply better. The right answer follows from three questions.
Where Does Your Data Already Live?
If the answer is Excel, SQL Server, Azure or Dynamics, Power BI starts several steps ahead and will keep that lead. If the answer is a mixed set of SaaS applications, or anything in the Zoho suite, Zoho Analytics removes more setup work.
Who Will Build the Reports?
A team with a data analyst, or someone willing to learn DAX, gets more out of Power BI over time. A team where a marketing or operations lead builds their own dashboards between other duties will get further, faster, with Zoho Analytics. This is a staffing decision as much as a software one, and it overlaps with how your organisation handles data-led decisions generally.
How Will the Bill Grow?
Power BI’s per-seat model is predictable and cheap at small headcounts, then scales linearly with viewers and jumps when you want Copilot. Zoho’s plan model bundles users and rows, which is efficient once many people need read access but hits a wall at the row limit. Model both at your expected size in two years, not today.

Conclusion
Zoho Analytics is the stronger default for small and mid-sized companies running a mixed software stack, especially where non-technical staff build their own reports and where AI assistance should come inside the subscription rather than on top of it. Its plan-based pricing also ages well as more colleagues ask for access.
Power BI is the stronger default for organisations already committed to Microsoft. The Excel and Azure connections, the governance tooling and the Teams integration compound into an advantage no feature list captures, and $14 per seat is easy to justify for a handful of users.
The mistake worth avoiding is choosing on a connector count or a headline price. Map your real sources, name the person who will maintain the reports, and price the setup you expect in two years. Whichever platform survives that test is the right one. If you are still weighing the category itself, our overview of business intelligence tools and the pieces on real-time data and predictive analytics are useful next steps.
Found this useful?
Make SmartKeys a preferred source on Google, and our articles will surface more often in your Top Stories, AI Overviews, and AI Mode.
Add as Preferred Source