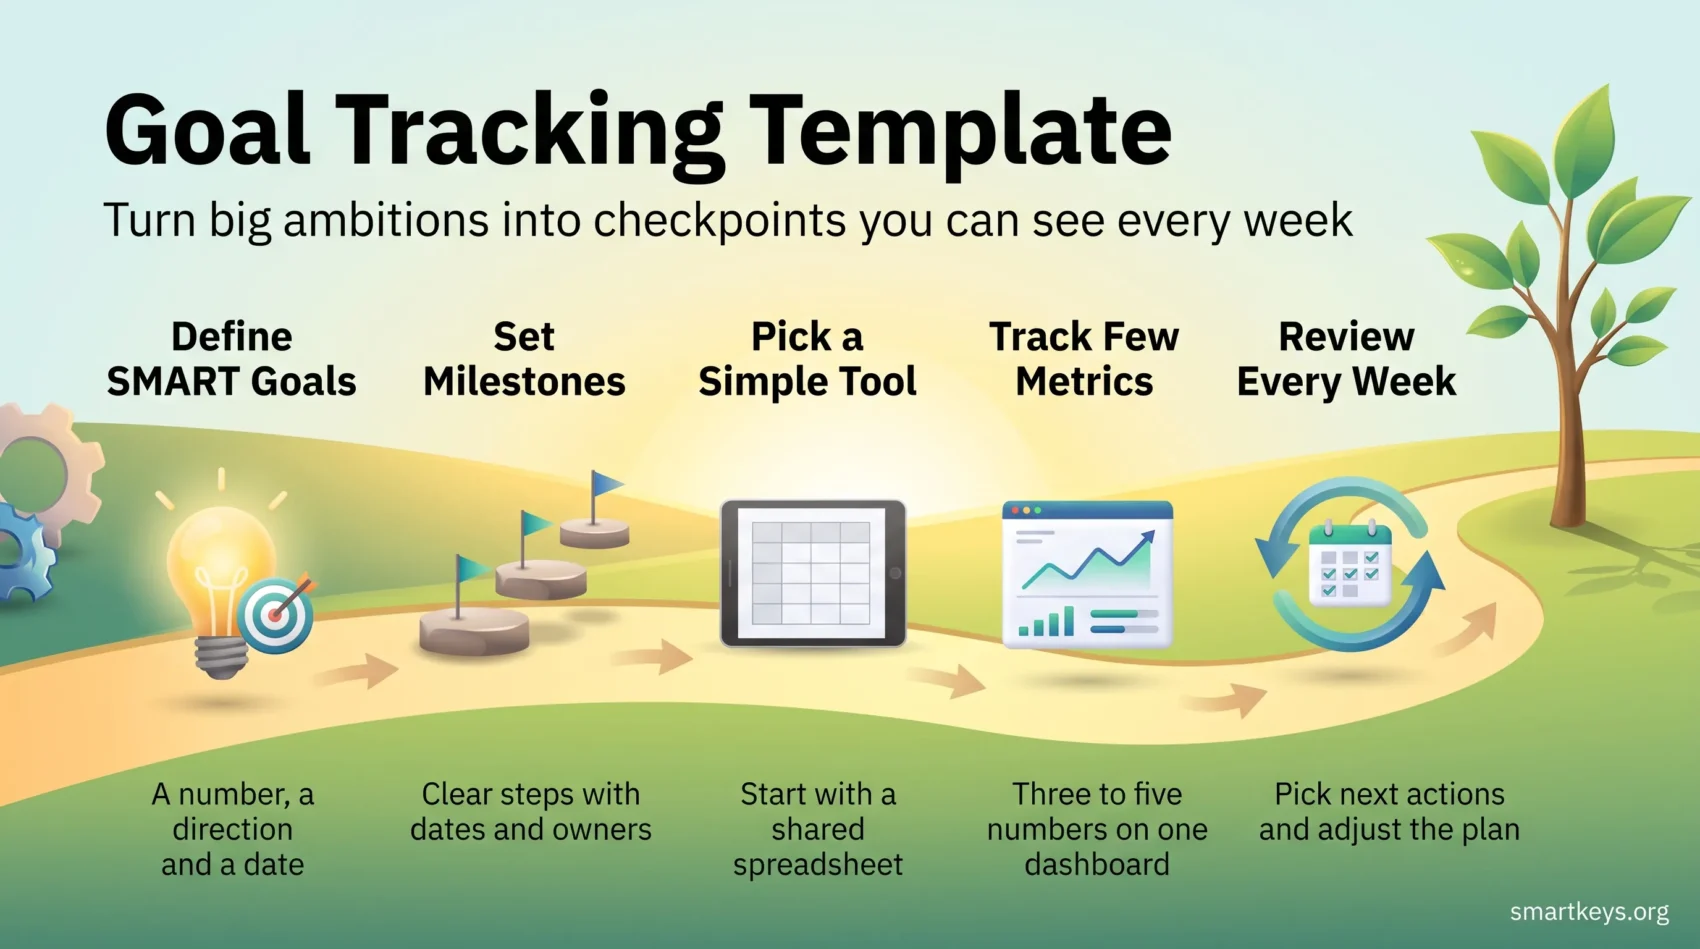
A goal tracking template is one simple, repeatable place where you write down what you want to achieve, how you will measure it, by when, and who owns it. It turns a vague ambition into a handful of checkpoints you can look at every week.
Big goals rarely fail on the deadline. They drift quietly for months because nobody is looking at them, and then the deadline arrives. Tracking fixes that by making progress visible instead of something you have to remember.
This guide covers what a tracking system is for, how to write goals you can measure, which tools fit, and how to run reviews that change what you do next.
Key Takeaways
- Break big aims into clear checkpoints, each with a date and an owner.
- Pick one main objective at a time so attention is not spread across a dozen priorities.
- Connect your own work to a business result, so progress means more than a finished task.
- Use a light system of reminders and brief reviews rather than a heavy reporting process.
- Track a few metrics that show real movement, not everything you happen to be able to count.
What goal tracking really solves
When you measure progress often, small corrections replace expensive surprises. A number checked every week tells you in March that something is off. The same number checked once a year tells you in December that it was.
Tracking also settles arguments. Instead of debating whether a project is on course, everyone looks at the same figure and moves straight to the question that matters: what do we change?
A concrete example: the Disney+ subscriber target
In December 2020, Disney told investors it expected Disney+ to reach 230 to 260 million subscribers by the end of its 2024 financial year. In August 2022 it cut that target to 215 to 245 million. When the year closed in late September 2024, Disney reported 122.7 million Disney+ Core subscribers plus 35.9 million on Disney+ Hotstar, roughly 158.6 million together.
The useful part is not that Disney missed. It is that the shortfall was visible quarter after quarter. That gave the company years to change pricing, content spending and bundling, rather than discovering the gap at the finish line.
Your version is smaller, but it works the same way:
- You see early whether a strategy is working, instead of guessing months later.
- A missed number becomes a clue about pricing, positioning or onboarding, not just bad news.
- Every metric has one named owner, so somebody is actually in a position to act on it.
The benefits of a robust goal-tracking system
When everyone can see the same priorities, teams move faster and waste less effort. Three benefits show up almost immediately.
Clarity, focus, and direction
Clear targets tell your team where to spend time. That reduces duplicated work and speeds up decisions, because the answer to “should I do this?” is usually visible on the board.

Motivation through visible progress
Seeing movement matters. A progress bar that filled up this week is a small, concrete reason to keep going. Named owners and short check-ins keep commitments in the open, which is why working with an accountability partner tends to beat willpower alone.
Performance measurement that finds friction
Measure a few meaningful metrics and you can spot where work stalls. Teams that follow a product-led growth approach, meaning the product itself does most of the selling through free trials and self-serve signup, use tracking to find exactly where new users give up: during onboarding, when looking for a feature, or at the upgrade screen.
The result is a habit of continuous improvement, where small wins compound instead of getting lost.
How to define your goals before you track them
Decide what success looks like in numbers and dates before any work starts. A tracker cannot rescue a goal that was never defined, so this step comes first. Our guide to goal setting that survives a real workweek goes deeper on the thinking behind it.
Use SMART statements to make progress measurable
SMART is a checklist for writing a goal: specific, measurable, achievable, relevant and time-bound. In practice it means replacing “improve onboarding” with something you could not argue about later.
Good examples: raise onboarding completion from 46% to 55% this quarter. Add 1,000 monthly active users within six months. Cut monthly cancellations by a fifth by the end of Q3.
Each one names a number, a direction and a date. That is the whole test.
Align personal goals with business goals
Connect what you are working on to a result the company cares about. If you cannot draw that line in one sentence, either the goal is not important or the link has never been explained. Both are worth knowing early.
On a team level, OKRs, a format that pairs one objective with two to four measurable key results, are the usual way to make that link visible to everyone.
Break large goals into steps and milestones
A goal you cannot start this week is too big. Split it into milestones with realistic dates, note which steps depend on each other, and write down the risks you already know about. Our guide to breaking large goals into smaller steps covers the mechanics.
- Define success up front with exact numbers and thresholds.
- Set the review rhythm now, not after the first thing slips.
- Keep the plan visible so other people can help remove blockers.
Choosing the right goal-tracking tools
Start with something your team will actually open. A shared spreadsheet that gets updated beats a sophisticated platform nobody logs into. Add features only once the habit is steady.
There are three practical categories, and most people need only one of them:
- Spreadsheets and documents (Google Sheets, Excel, Notion): fastest to set up, easy to share, and flexible enough for almost any goal. Start here unless you have a specific reason not to. Ready-made templates remove most of the setup work.
- Project and work management tools (Asana, ClickUp, Monday.com, Hive, Jira): worth it once goals involve several people, dependencies and due dates that keep moving. These tools connect the goal to the tasks underneath it.
- Habit and routine apps: better suited to daily personal behaviour than to quarterly business targets. If your goal is really a habit, a habit tracker will serve you better than a dashboard.
Analog still works. A whiteboard or notebook is fine for daily notes, and many people combine both: paper for the day, a shared tool for anything others depend on.
Before committing, check reminders, dashboards, permissions and integrations, and compare free tiers first. Pricing on all of these tools changes regularly, so confirm the current plan details on the vendor’s own site rather than trusting a comparison article, including this one.
Essential features of a goal-tracking system
A good system captures the events that matter and turns them into signals you can trust. Four capabilities do most of the work.
Event tracking to capture actions and milestones
An event is a single recorded action: a signup, a first project created, an upgrade. Event tracking logs those actions and ties them to your milestones, so you can see how far people get rather than only how many arrived.
Map each event to a stage in the journey (signup, activation, adoption) so the sequence tells a story instead of producing a pile of counts.
Dashboards that surface the few metrics that matter
Design the dashboard around a handful of numbers. Every extra widget makes the important one harder to find. If you want a starting layout, our productivity dashboard template shows one that fits on a single screen.
Automated reporting to keep people informed
A scheduled report removes the weekly scramble for an update. It also stops progress from being reported only when the news is good, which is the quiet failure mode of manual reporting.
Integrations for one shared view
Pick something that connects to the systems already holding your data: your CRM, your analytics, your billing. When numbers are copied by hand, they drift, and a metric nobody trusts gets ignored. Larger teams often move this layer into a dedicated business intelligence tool.
- Set alerts and thresholds so anomalies find you instead of the other way round.
- Agree naming conventions, so “active user” means the same thing to everyone.
Why a visual tracker beats a list of numbers
A chart shows a trend in a second that a table hides in a hundred rows. That speed is the whole point: you notice the dip in week three rather than in the quarterly review.
See trends at a glance
Charts, checklists and progress bars turn data into something you can read without concentrating. Gaps become obvious. Turning raw figures into a usable view is a skill in itself, which our piece on the analytics maturity model unpacks.
Make progress easy to keep up with
Visible wins raise motivation. Colour coding, progress bars and simple onboarding checklists keep attention on the next action rather than the whole mountain.
- Pair leading indicators, the early signs, with the outcome you actually want, so you can adjust before the result is fixed.
- Keep the view small enough to become a daily home base rather than a monthly chore.
How to set the system up
Start by naming the outcomes you expect and who owns each one. Everything else is easier once those two things are written down.
Set up: outcomes, tool, metrics
Define the outcomes, the metrics and the owners first. Then choose a tool that fits, configure three to five metrics, check that the data is right, and write a one-page note explaining what each metric means. New contributors will need it in week one.
Best practices: clear metrics, short reviews, visuals
Keep reviews brief and scheduled. Automate reminders and reports so following up does not become somebody’s part-time job. If review meetings are eating the week, a focus time policy protects the hours where the actual work happens.
Bring the team in
Assign tasks and due dates in whatever tool you already use, and put the check-ins in the calendar. Write down decisions after each review so the process itself improves. Documented standard operating procedures stop the same questions returning.
- Audit your metrics once a quarter and delete the ones nobody has acted on.
- Agree in advance what happens when a target slips, and who is told.
- If several goals compete, use a task prioritization framework to decide which one gives way.
Use the data to adjust your goals
The point of tracking is to change something. If a review never leads to a different decision, it is a status meeting wearing a costume.
Build a feedback loop
Keep it simple: pull the data, review it, assign one or two actions, set the next date. Short and scheduled beats thorough and occasional.
“Compare the trend against the target, and act before the gap compounds.”
- Look at segments, not just totals. A flat average often hides one group improving and another falling away.
- Run a “stop, start, continue” round at each review, with a named owner for every item.
- Revisit the milestones themselves. A deadline set six months ago may simply be wrong now.
One caution: explain changes clearly. A timeline that shifts without a reason reads as a target quietly being dropped, and people stop believing the next one.
A goal-tracking example for a SaaS product
Subscription software has a standard set of measures, and it is worth knowing what they mean before using them.
The core metrics: MRR and ARR are monthly and annual recurring revenue, the predictable income from subscriptions. Churn is the share of customers or revenue lost in a period. LTV, or lifetime value, is the total revenue you expect from one customer before they leave. Together they tell you whether growth is real or just a busy month of signups.
Use OKRs to connect work to outcomes
Turn strategy into objectives with numeric key results. An objective states the direction (“make the first week obviously useful”), and the key results say how you would know (“onboarding completion from 46% to 55%”). Keep them public so a team can see how its feature work rolls up.
Connect product management and analytics
Link the tracker to the product board and the analytics tool, so priority, delivery and outcome sit in one workflow. Segment users by lifecycle stage to see which features drive activation, retention and expansion, then align marketing to the same signals.
- One owner per metric: so each team knows the lever it controls.
- Leading indicators on the dashboard: onboarding completion and feature adoption move before revenue does.
- Experiments with a hypothesis: measure the effect on recurring revenue, churn and lifetime value, not on page views.
Keep a short playbook with metric definitions, alert thresholds and the reporting rhythm. New hires get up to speed in days instead of months, and nobody reinvents the definition of an active user.
Making it work in an ordinary week
A tracking system only survives if it fits the week you actually have. Small routines do more here than ambition.
Review, reflect, and mark the milestones
Book a short review each week to look at what moved and pick the next few steps. A structured weekly planning session is usually enough, for personal goals as well as team ones.
Build routines and protect the time
Start the day with a short plan and end it with a two-line summary. Setting daily intentions makes that plan stick, and time blocking reserves the hours the goal needs. Protect those hours by silencing notifications. When everything looks urgent, the Eisenhower Matrix separates what matters from what is merely loud, and a not-to-do list protects the decision once you have made it.
- Break work into pieces small enough that something finishes most days. Our guide to micro goals explains the approach.
Conclusion
End every planning cycle with one clear next step. That single habit is what turns intentions into measurable action and keeps daily work pointed at something larger.
Keep the setup light: a few metrics, named owners, a visible board and a short weekly review. The system should cost you minutes, not afternoons. Stronger self-management comes from the rhythm, not from the tool.
Celebrate the wins and study the misses. Start with one focused action this week, then let the data decide what comes next.
Found this useful?
Make SmartKeys a preferred source on Google, and our articles will surface more often in your Top Stories, AI Overviews, and AI Mode.
Add as Preferred Source