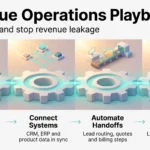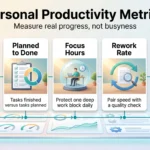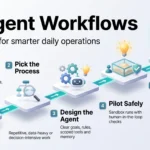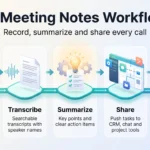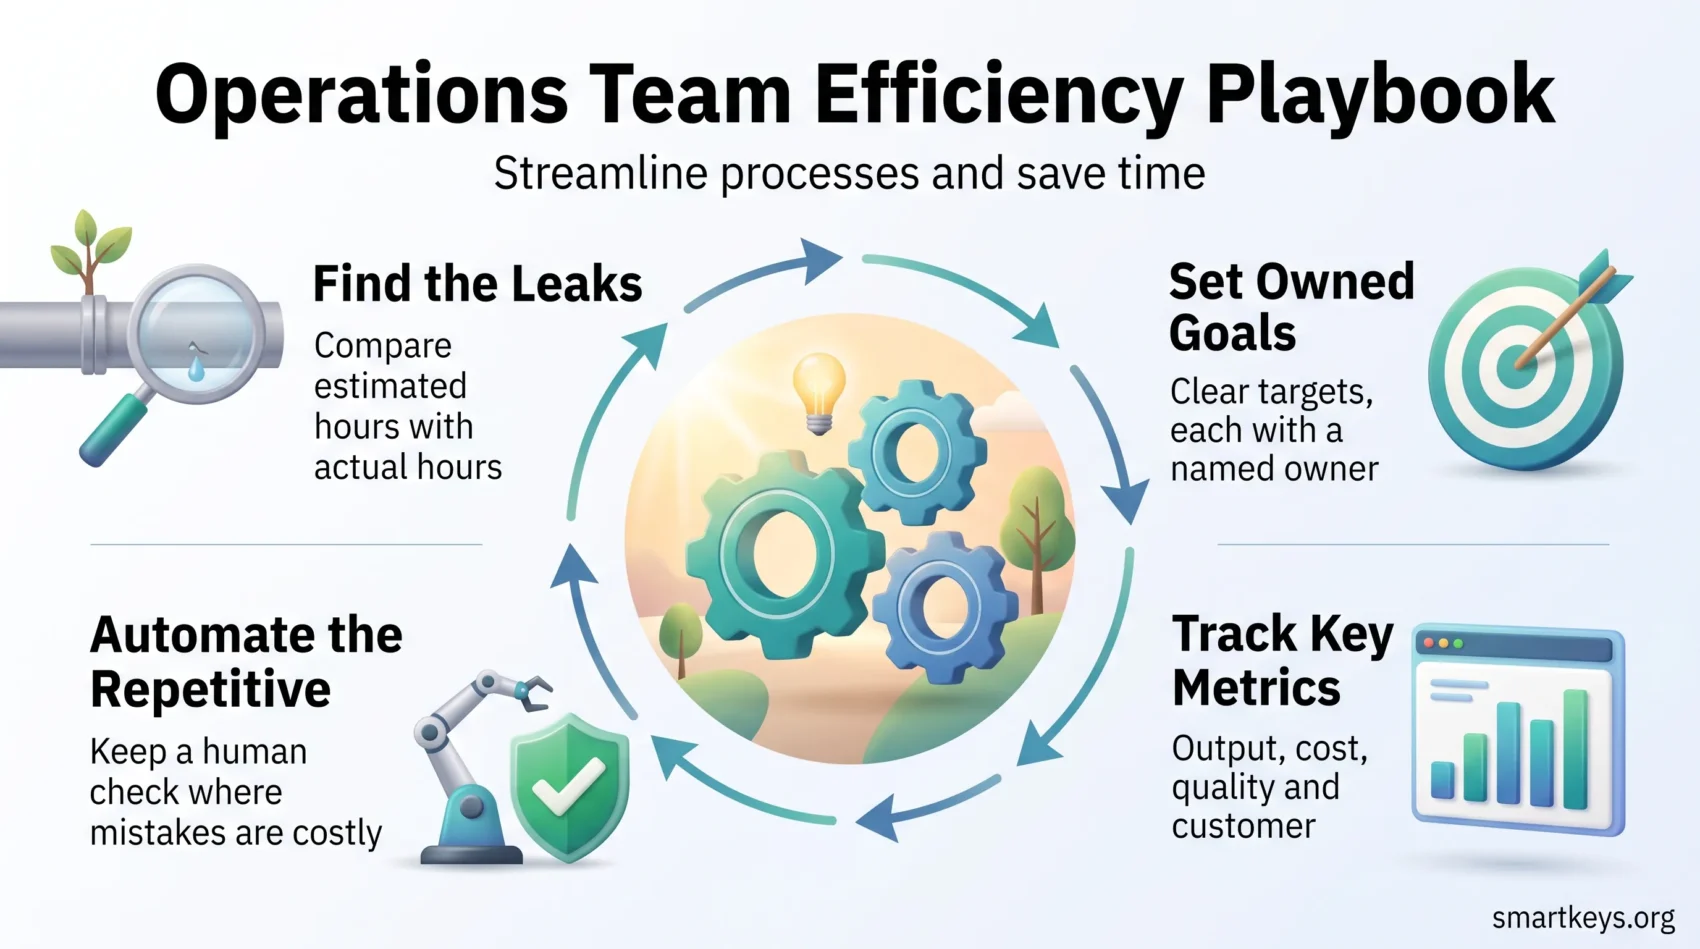
This playbook gives you a practical path to get more done while cutting cost and wasted time.
Most teams do not have a motivation problem. They have a plumbing problem. Work sits in queues, gets re-done after a bad handoff, or waits on an approval nobody owns. None of that shows up in anyone’s to-do list, which is why it survives year after year.
Operational efficiency is the discipline of fixing that plumbing: delivering the same result with fewer inputs, meaning fewer hours, fewer handoffs and less rework.
This guide walks through the whole loop. How to find where time leaks, how to set goals your finance team recognizes, which numbers to track, and which fixes are worth the effort.
Key Takeaways
- Efficiency is output per unit of resource. Productivity is only output. The difference is where margin lives.
- Diagnose before you optimize: compare estimated hours with actual hours and find the steps that always run long.
- Track a short list of numbers across four areas: output, cost, quality and customer.
- Automate the repetitive steps first, and keep a human check at the points where mistakes are expensive.
- Engagement, communication and clear ownership are efficiency levers, not soft extras.
What Operations Efficiency Really Means
Two agencies can ship the same number of projects in a month. One is quietly profitable, the other is not, and the difference is rarely effort.
Productivity counts how much work gets finished in a given time. Operational efficiency asks what that work cost you: hours, tools, rework, waiting. A team can be highly productive and badly inefficient at the same time, if half of its output has to be corrected later.
That distinction matters because only one of the two shows up in your margin. For the output side of the equation, from goals and roles to tools and leadership, see our broader guide to boosting team productivity. This playbook stays on the operations side: cost, waste and process flow.
Service and production: the same problem, different levers
In a service business, the raw material is people’s time. You optimize schedules, handoffs and how fast someone can find the file they need. Centralizing templates sounds trivial, but it removes a small delay that happens dozens of times a week.
In production, the raw material is physical flow: changeover times, layout and defect rates, so machines and floor space are not idle.
The underlying question is identical. Where does a unit of work stop moving, and why?
Where waste usually hides
- Duplicated effort. Two people prepare the same report because neither knows the other does.
- Unused output. A weekly deck nobody reads still costs four hours to build.
- Unclear handoffs. Work sits in an inbox because the next owner was never named.
- Silent rework. Corrections get absorbed into the “normal” project time and never get counted.
Written procedures are the cheapest defense against all four. Our guide to standard operating procedures teams actually use covers how to keep one short enough to be followed.
Diagnose Bottlenecks Before You Optimize
Start with numbers, not opinions. The goal of this stage is a short list of steps that reliably cost you days.
Compare estimates with actuals
Pull the last several projects and compare planned hours against booked hours. That gap is called schedule variance.
Look for patterns, not one-off misses. If the same step overruns on every project, it is a process problem rather than a person problem, and it deserves a proper root-cause review.
If you do not yet know where time goes, run a time audit for two weeks first.
Map the process end to end
Draw the actual route a piece of work takes, including every approval and every wait. Teams are usually surprised by two things: how many approvals exist, and how much of the elapsed time is queuing rather than working.
Mark each step with its typical duration and its rework rate. Those two columns tell you almost everything.
Ask the people doing the work
Interview the staff who run the process daily. They can name the annoying step in ten seconds, and they usually know the fix. Then add customer feedback, because clients notice slow stages that internal reviews miss.
Prioritize the fixes
You will have more candidate fixes than capacity. Rank them by cycle-time impact against effort, so the first wins land in weeks rather than quarters. If ranking is the hard part, compare the options in our overview of task prioritization frameworks.
Small diagnostics on a regular cadence beat one large audit a year.
Set SMART Goals and KPIs That Tie to Business Outcomes
Once you know where the leaks are, turn the biggest ones into goals somebody owns.
Use the SMART test, meaning a goal that is Specific, Measurable, Achievable, Relevant and Time-bound. “Improve delivery” fails it. “Cut average approval wait from four days to one by the end of Q2” passes.
From pain point to target
Anchor each goal to something the business already cares about: revenue, margin or delivery quality. Ground the target in your own history plus an external benchmark, so it is ambitious without being fiction.
For professional services and agencies, the usual anchor is billable utilization, meaning the share of an employee’s available hours that is billable. SPI Research’s 2026 Professional Services Maturity Benchmark put average billable utilization at 66.4% in 2025, its lowest recorded level and well short of the 75% many firms target. On-time delivery sat at 73.8% and average project overrun at 10.7%. Useful reference points, not laws.
Leading and lagging indicators
A KPI is simply the one number you have agreed measures a goal. Split your KPIs into two kinds.
Leading indicators move early and let you steer: pipeline against available capacity, task age, on-time task starts, first-time-right rate.
Lagging indicators confirm the result after the fact: margin, delivery cycle time, customer satisfaction. They prove the change worked but arrive too late to change it.
Track both. Leading indicators without lagging ones create busywork. Lagging indicators alone leave you steering by the rear-view mirror.
- Give every KPI a named owner. A metric owned by “the team” is owned by nobody.
- Align department goals to company outcomes, so one team’s win is not another team’s backlog.
- Put the numbers on a rhythm: weekly review, quarterly reset.
Operations Efficiency Metrics You Should Track
Good metrics cut through noise and show which fix will actually move the needle. Four groups are usually enough.

Output
Tasks completed per employee, billable hours, revenue per employee. These show what each role actually produces, and they expose the gap between a busy team and a productive one.
Cost
Labor cost as a share of revenue, average cost per employee, overhead ratio. In service businesses payroll is usually the largest single cost line, so small changes here move margin more than anything else on the list. Software spend belongs here too, and it is the easiest place to find quick savings: see our guide to cloud cost optimization.
Quality
Error rate, share of work that needs rework, hours lost to defects. Rework is the most expensive number on this page because you pay for the same output twice.
Customer
Customer satisfaction (CSAT), retention rate, average resolution time. These are your safety rail. If they slip while your cost metrics improve, you have not become efficient. You have moved the cost to the customer.
Capacity
Utilization, available capacity, cycle time. Cycle time is how long one item takes from start to finish, including waiting. It is often the single most honest measure of a process.
- Pick roughly two numbers per group. More than eight and nobody reads the report.
- Write down the definition and the data source for each, so two departments cannot report the same metric differently.
- Review the slate once a quarter and retire whatever nobody acted on.
Track fewer, clearer metrics and the gains come faster.
How to Measure Operational Efficiency with the Right Tool Stack
A right-sized measurement stack turns scattered numbers into answers people trust. Three layers do the job.
Business intelligence for a shared view
Business intelligence (BI) tools pull data from several systems into one dashboard. Power BI, Tableau and Looker Studio are the common choices. The point is not prettier charts. It is that finance, delivery and leadership stop arguing about whose spreadsheet is right. Our comparison of business intelligence tools covers what each one suits.
Activity and workforce data
Time tracking, project tools and workforce analytics tools show where hours go and which tasks repeat often enough to be worth automating. Be deliberate about scope: monitoring that feels like surveillance destroys the trust you need for accurate data.
Dashboards and a reporting cadence
Agree one set of filters and time windows across teams, or every meeting starts with a reconciliation. Put leading indicators on the weekly view and lagging outcomes on the monthly one. If you want something lighter for an individual team, a simple productivity dashboard often beats a full BI rollout.
Continuous measurement is what lets you move resources with confidence instead of instinct.
Improve Operational Efficiency with Process Automation
Automating the right steps speeds work and removes a whole class of errors. Automating the wrong ones just makes a bad process run faster. Start by mapping one process you run every day, and look for three signals: repeated handoffs, manual copy and paste, and approvals that sit.
Where to start
Finance flows are usually the best first target. Pull time data, generate invoices, route approvals. The rules are clear, the volume is high, and billing errors are expensive. Our guide to finance automation goes through the sequence.
Project reporting is the second. Status notifications and progress summaries can be generated instead of assembled by hand, which gives managers a live view without anyone building a deck.
From there, work through the rest of your digital workflows and, once the simple wins land, join them up end to end.
No-code, with a human at the gate
No-code tools let you wire triggers, actions and exceptions without a developer. They are quick to build and quick to break, so design the exceptions deliberately. Keep a human approval wherever a mistake is costly or hard to reverse: a payment, a client-facing document, a contract. Everywhere else, let it run. Our overview of low-code process automation covers what these platforms handle well and where they stop.
- Automate the highest-volume process first, not the most annoying one.
- Standardize the template before you automate it, or you will hard-code today’s mess.
- Measure cycle time and error rate before and after each rollout. If neither moved, revert it.
People, Capacity and Culture
Process work fails quietly when the people side is ignored. Capacity planning and hiring are the same conversation, not two.
Hire and develop against bottlenecks
Hire for the capability that unblocks work, not for the title on the org chart. Often the answer is not a hire at all: training one person to cover a review step removes the queue waiting on a single approver.
Link individual goals to the business outcome they affect, so people see which part of the machine they are improving. And be honest about what should not be theirs at all: our guide to effective delegation covers how to hand work over without handing over the outcome.
Engagement is a performance metric
Engagement is not a morale bonus. Gallup’s Q12 meta-analysis, which pooled 183,806 business units across 736 studies in its 2024 edition, found that top-quartile business units were 23% more profitable than bottom-quartile ones, with lower absenteeism, lower turnover and fewer defects.
The backdrop is not encouraging. Gallup’s 2026 State of the Global Workplace report put global engagement at 20% in 2025, its lowest level since 2020, with manager engagement falling from 27% to 22%. Gallup estimates the cost of low engagement at roughly $10 trillion in lost productivity, around 9% of global GDP.
Track the early signals yourself: employee net promoter score, voluntary turnover and absenteeism. For distributed teams, see what the evidence supports on remote employee engagement and on retention.
- Balance workload across roles rather than loading the most reliable person.
- Give regular feedback rather than an annual verdict.
- Recognize the improvements, not just the heroics. Otherwise firefighting stays the fastest route to praise.
Time Tracking that Teams Actually Use
Time data feeds almost every metric above, and it is also the input people quietly stop entering. Tracking works when it fits the way people already work: logging done at 6pm from memory produces numbers you should not plan with.
Capture non-billable work too
Meetings, research and internal reviews are real project costs. Leave them out and your estimates will keep coming in low, because you are pricing only the visible half of the job.
Keep the input friction low
Use built-in timers, calendar sync and logging directly from the task. When someone can start a timer in one click from the item they are working on, entries happen in the flow of work. Tag them with enough context to see where estimates drift and why.
- Feed actual hours back into your next estimate, or tracking is pure overhead.
- Use the data to rebalance workload, not to rank people.
- Train managers to coach with it. The moment it is used punitively, the numbers become fiction.
For the individual habits underneath all of this, our guide to time management techniques is the practical companion.
Build Communication Systems that Prevent Firefighting
When updates are predictable and live in one place, people stop chasing answers and start finishing work.
The cost of getting this wrong is well documented. In a 2018 Economist Intelligence Unit survey of 403 US executives, managers and staff, commissioned by Lucidchart, 52% said communication barriers had increased their stress and 44% said the barriers had delayed or derailed projects.
One place for status
Put goals, owners and due dates in a single source of truth. A project board or a status dashboard both work. What matters is that there is exactly one, and that it is current.
Make asynchronous updates the default for routine status, and reserve live time for decisions and problems that need argument.
Rituals that hold
A short daily standup, a weekly review and a monthly demo cover most teams. Define where decisions are recorded and how a risk is escalated, so exceptions have a route that does not depend on who happens to be online.
If your calendar is the bottleneck, start with a meeting audit, then apply the practices in our guides to effective meetings and clear communication. Distributed teams should also look at silent meetings, which replace most of the talking with structured reading and written input.
Predictable communication is cheaper than heroic communication.
Control Costs Without Sacrificing Quality
The aim is to trim what does not add value while delivery stays strong. That order matters.
Trim the easy spend first
Look at unused software seats, duplicate subscriptions and space you no longer need before you look at headcount. These cuts are reversible and nobody’s job depends on them.
Watch labor as a share of revenue alongside your overhead ratio. Payroll is the largest cost line in most service businesses and a much smaller one in manufacturing, so the right benchmark depends on your model, not on a universal number. Pilot a saving on one team, measure the effect on delivery, then scale what survives.
Protect quality on the way
Rework is where cost cutting usually backfires. A change that saves an hour upfront and creates three hours of corrections is not a saving, so pair every cost metric with a quality metric. Keep simple QA checklists at the points where defects are caught cheaply, and write the standard down so the improvement does not quietly regress under deadline pressure. That habit is the core of continuous improvement: small, documented changes that hold.
Cut cost with a scalpel. Measure the delivery impact before you scale the cut.
Operational Efficiency in Practice
Three plays that translate across industries.
Agencies: centralize assets and standardize templates
Put brand assets, project templates and feedback in fixed, findable places. Each retrieval saves a couple of minutes, and a team does this dozens of times a day.
The second-order effect is bigger: standard templates mean fewer review rounds, because reviewers stop correcting the same formatting issues on every project.
Manufacturing: reorganize space before you expand
Before signing for more floor space, map the current flow. Storage that grew organically often occupies room that production needs, and rebalancing the layout can release capacity that looked like it required a new building. The same logic applies to software: rebalancing what you already own is cheaper than buying the next tier.
Professional services: connect time, budget and billing
Professional services automation (PSA) tools link forecasting, delivery and invoicing in one system. The value is not the forecast itself. It is seeing a project drift toward a margin problem while there is still time to act.
Conclusion
Operational efficiency is not a project you finish. It is a loop you keep running: measure, find the leak, fix it, check the fix held.
Pick a small number of metrics across output, cost, quality and customer. Use leading indicators to steer during the quarter and lagging ones to confirm the result afterwards. Invest where the return is visible, which is usually people, handoffs and tooling, in that order.
Above all, keep the loop closed. Share the decision and the data behind it. Teams adopt a change far faster when they can see why it was made.
Found this useful?
Make SmartKeys a preferred source on Google, and our articles will surface more often in your Top Stories, AI Overviews, and AI Mode.
Add as Preferred Source